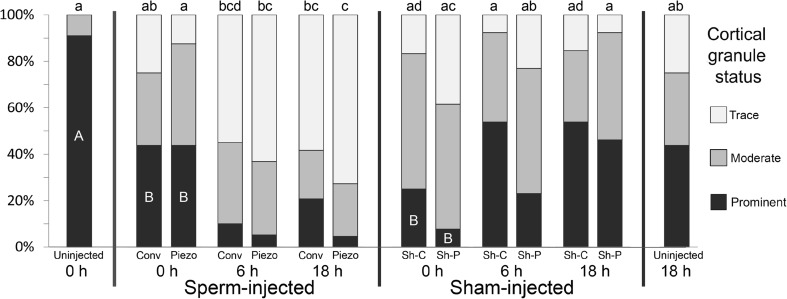
Fig. 6.
Proportion of oocytes showing prominent, moderate, or trace cortical granules (CG) at the periphery of the cytoplasm in uninjected oocytes at 0 or 18 h, and at 0, 6, and 18 h after conventional (Conv) and Piezo ICSI or sham injection (Sh-C and Sh-P, respectively). a–d For Trace CG, values with different superscripts differ significantly (P < 0.05); A, B: For Prominent CG, within 0H groups, values with different letters differ significantly (P < 0.01)

