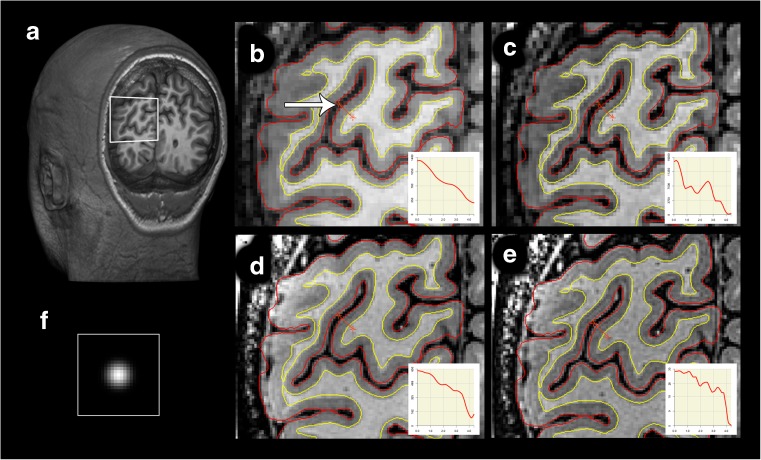
Fig. 1.
Result of deconvolution of 3 T and 7 T scans, coronal slice. Effect of deconvolution shown in a coronal section of the occipital lobe for one participant for the area of interest displayed in the white rectangle in (a). The four panels on the right indicate the area of interest in an original (a) and deconvoluted (b) 3 T T1w 0.8 mm isotropic scan and in an original (d) and deconvoluted (e) 7 T myelin-sensitive T1w 0.5 mm isotropic scan. Freesurfer white (red) and pial (yellow) surfaces are overlaid. Insets display signal intensity sampled along displayed orange ruler (marked by the white arrow), with 3DSlicer 4.4.0, which is 4.2 mm in length and runs from white matter to CSF. Please note that this sample is drawn in a 2D projection and is not necessarily perpendicular to the cortical mantle. (f) depicts the PSF used

