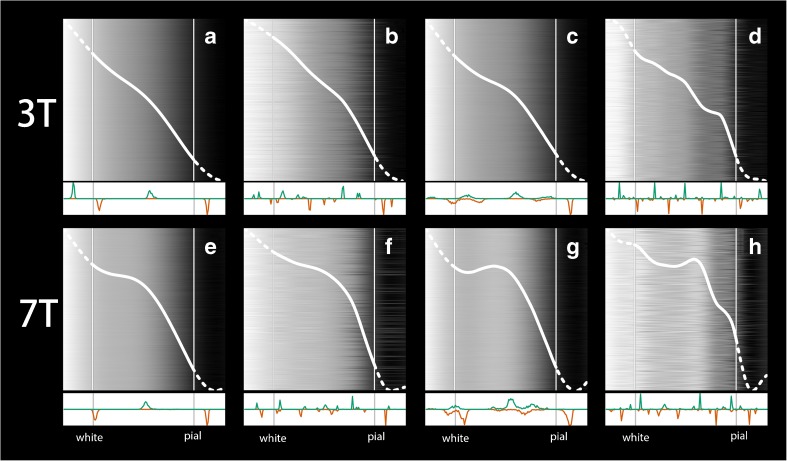
Fig. 3.
Results of method applied on in vivo data in V1. Top row displays 3 T results, with displaying BAM profiles and corresponding peak and valley histograms of (a) non-deconvoluted nonaligned data, (b) aligned, non-deconvoluted data, (c) non-aligned, deconvoluted data; (d) aligned deconvoluted data; bottom row (e)–(h) depict result of identical processing, but for 7 T data. Note that the histograms are scaled to the maximum number of peaks or valleys

