
Fig. 2.
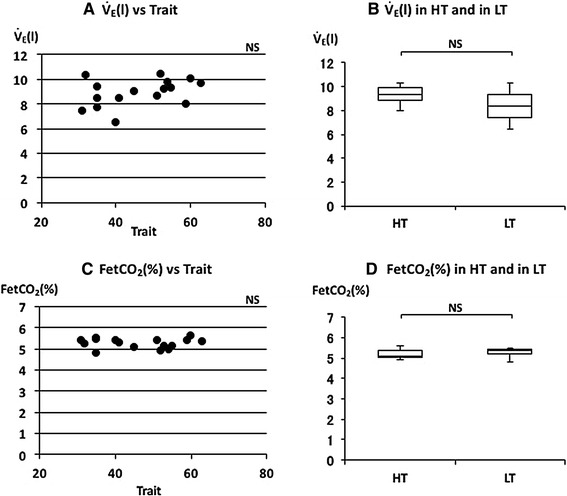
The relationships between minute ventilation (), end-tidal CO2% (FetCO2), and trait anxiety. a Linear plot of and trait scores. No significant correlation was observed (ρ = 0.384). b Comparison of in HT and in LT. No significant difference was observed in . c Linear plot of FetCO2 and trait scores. No significant correlation was observed (ρ = −0.038). d Comparison of FetCO2 in HT and in LT. No significant difference was observed in FetCO2. Median and FetCO2 in HT and LT were indicated with horizontal bars. The vertical bars indicate the range and the horizontal boundaries of the boxes represent the first and third quartiles