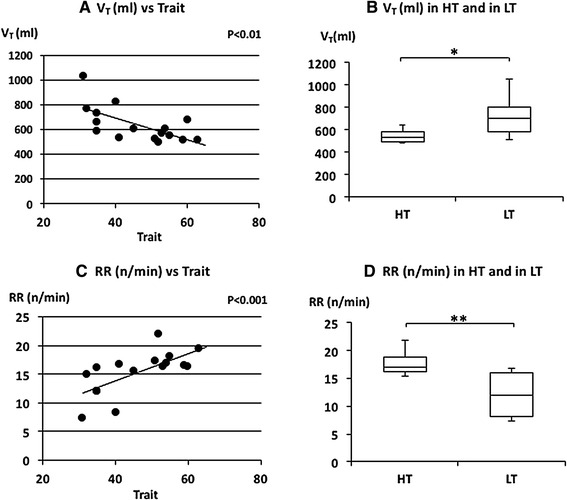
Fig. 3.

The relationships between tidal volume (V T), respiratory rate (RR) and trait anxiety. a Linear plot of V T and trait scores. A significant negative correlation was observed (ρ = −0.687, p < 0.01). b Comparison of V T in HT and in LT. V T in LT was significantly larger than in HT (*p < 0.05). c Linear plot of RR and trait scores. A significant positive correlation was observed in RR (ρ = 0.749, p < 0.05). d Comparison of RR in HT and in LT. RR in HT was significantly higher than in LT (**p < 0.01). Median V T and RR in HT and LT were indicated with horizontal bars. The vertical bars indicate the range and the horizontal boundaries of the boxes represent the first and third quartiles
