
Fig. 5.
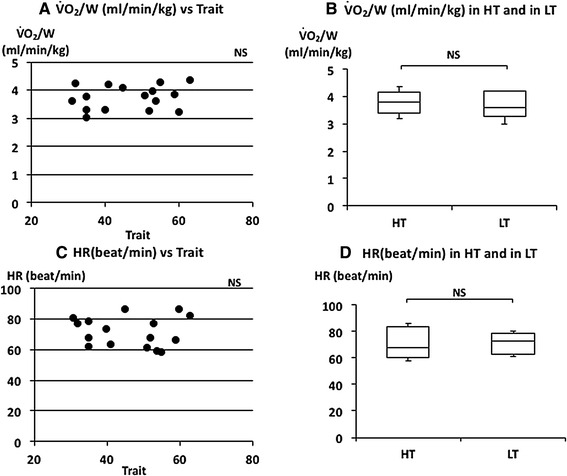
The relationship between oxygen uptake (), heart rate (HR), and trait anxiety. a Linear plot of and trait scores. No significant correlation was observed (ρ = 0.209). b Comparison of in HT and in LT. No significant difference was observed in . c Linear plots of HR and trait scores. No significant correlation was observed (ρ = −0.047). d Comparison of HR in HT and in LT. No significant difference was observed in HR. Median and HR in HT and LT were indicated with horizontal bars. The vertical bars indicate the range and the horizontal boundaries of the boxes represent the first and third quartiles