
Supplementary Figure S3.
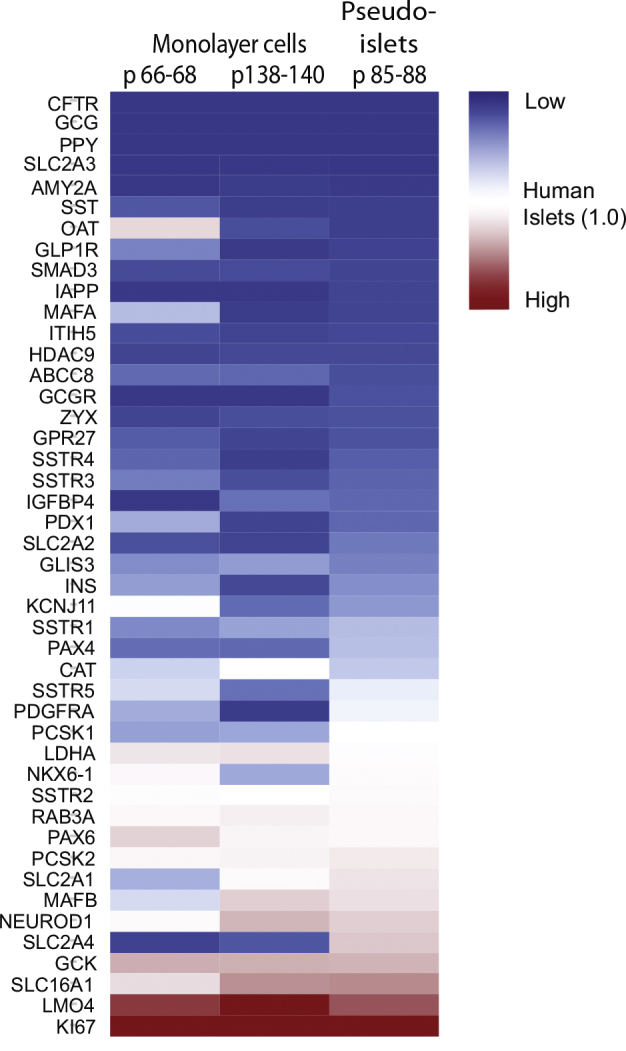
mRNA-expression in EndoC-βH1 monolayer cells (two different passage groups) and pseudoislets. All mRNA levels are shown as fold change relative to the levels obtained from 4 independent preparations of human islets. The bar on the right side of the figure shows the lowest (blue) and the highest (red) expression values compared with the levels in human islets set at one (white). The Ct-values for mRNA expression of the following genes is above 32: AMY2A, CFTR, GCG, GCGR, IGFBP4, ITIH5, MAFA, OAT, PDGFRA, PPY, SLC2A2, SLC2A3, SSTR4, and ZYX.