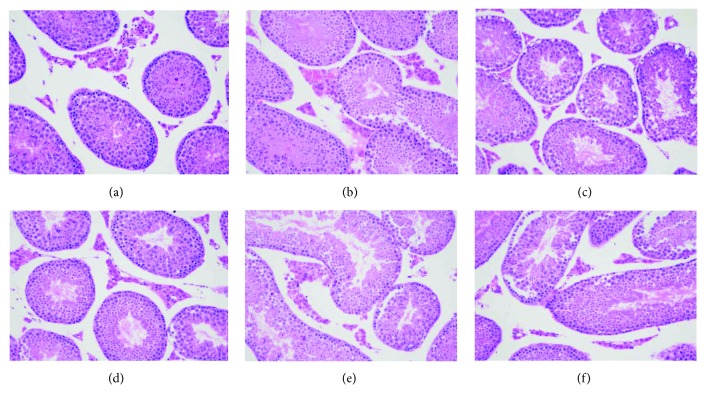
Figure 3.
Light microscopic changes of the Leydig cells in six experimental groups in week 12. Light microscopic images showing morphological changes in testicular cells in week 12. Images show the control group (a), DIO group (b), DEHP group (c), DIO + DEHP low group (d), DIO + DEHP middle group, and (e) DIO + DEHP high group (f). Sections were stained with HE staining. Magnification ×40.

