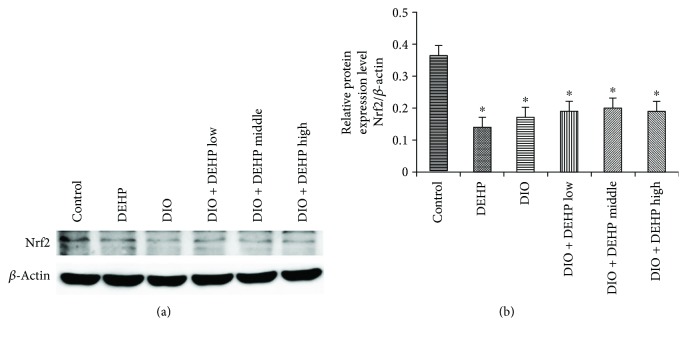
Figure 5.
Expression of Nrf2 protein in the 6 experimental groups of mice. The upper bands (a) depict representative findings in the control, DIO, DEHP, DIO + DEHP, DIO + DEHP middle, and DIO + DEHP high groups. The lower bar graphs (b) show the results of the semiquantitative measurement of Nrf2. Each bar represents mean ± SE. n = 4. ∗ indicates a significant difference from the control group, P < 0.05.

