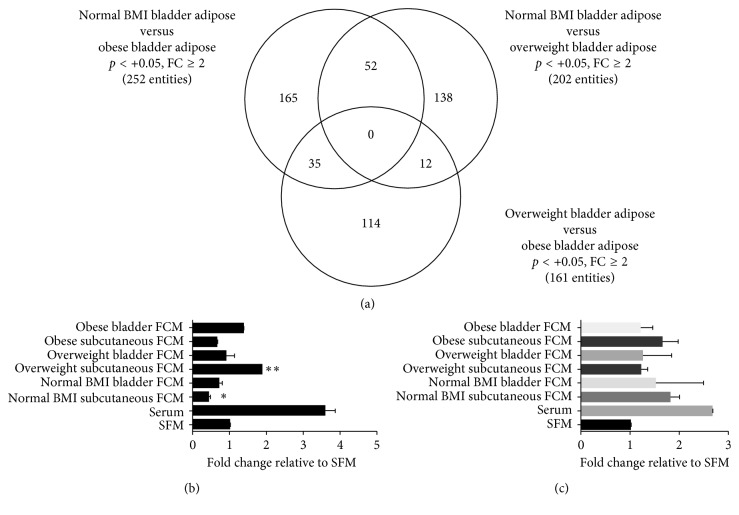
Figure 1.
Gene expression profiling of bladder adipose tissue and effects of the influence of explant CM on T24 cancer cell behavior. (a) A Venn diagram representative of gene transcripts differentially regulated in the patient bladder fat between the groups: normal BMI versus obese, normal BMI versus overweight, and overweight versus obese. (b) Adipose whole explant CM from a normal weight patient, an overweight patient, and an obese patient was placed in the bottom of a Boyden chamber, and T24 cells were placed in the upper chamber. Serum-free media (SFM) was used as a control. Migrated cells were stained and counted. ∗ p < 0.05 and ∗∗ p < 0.01 are statistically significant. (c) Fat CM harvested from a normal weight patient, an overweight patient, and an obese bladder cancer patient was placed in the bottom of a Transwell invasion chamber, and T24 cells were placed in the upper chamber. Serum-free media (SFM) was used as a control. Invasive cells were stained and counted. ∗ p < 0.05 and ∗∗ p < 0.01 are statistically significant.

