Figure 2.
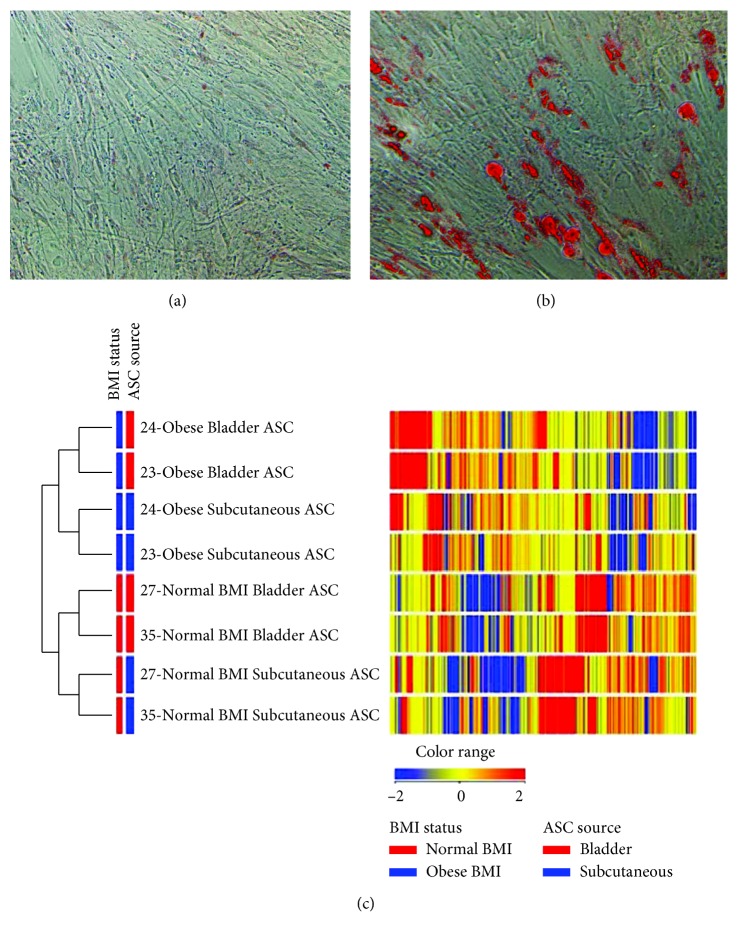
Characterization of bladder ASCs. Primary ASC cultures were allowed to grow to confluence in 6-well plates and were treated (a) without or (b) with the adipogenic differentiation medium. Adipogenic cells were stained using Oil Red O. (c) A heat map representative of differential gene expression in ASCs isolated from matched bladder and subcutaneous sites from two normal weight and two obese patients shows clustering based on the BMI status and ASC source. Transcripts are at least twofold differentially regulated (p < 0.05). The heat map indicates upregulation (red), downregulation (blue), and comparable levels of gene expression (yellow) and clustering based on the anatomical source of ASCs, as well as the BMI. PT = patient ID; BL = bladder; SQ = subcutaneous.

