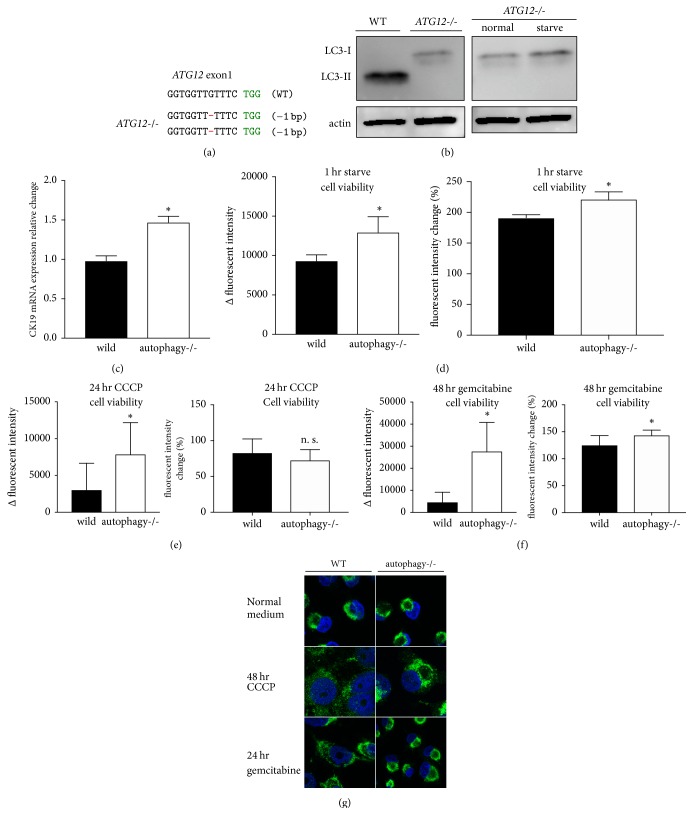
Figure 1.
Autophagy deletion pancreatic cancer cells. (a) ATG12-deficient MIA PaCa-2 genomic DNA sequence. Bases shown in red are indels (insertions and deletions). PAM sequence is shown in green. (b) Lysate of wild-type and ATG12-deficient MIA PaCa-2 cells. Starvation was induced by culturing the cells in PBS for 1 hr. LC3-II is a marker of autophagy. Actin was used as a loading control. (c) CK19 (KRT19) mRNA quantitative reverse transcription PCR. The vertical axis is the fold change relative to the GAPDH control. (d) Change in alamarBlue fluorescence after 1 h of starving. (e) alamarBlue fluorescence at 24 h with 10 μM of CCCP added to the culture. (f) Change in fluorescence at 48 h, when 500 nM gemcitabine was added. (g) Confocal microscopy of immunofluorescent staining. Mitochondria are in green; Hoechst stain is in blue. ∗a value of P < 0.05 represents statistical significance.

