Figure 5.

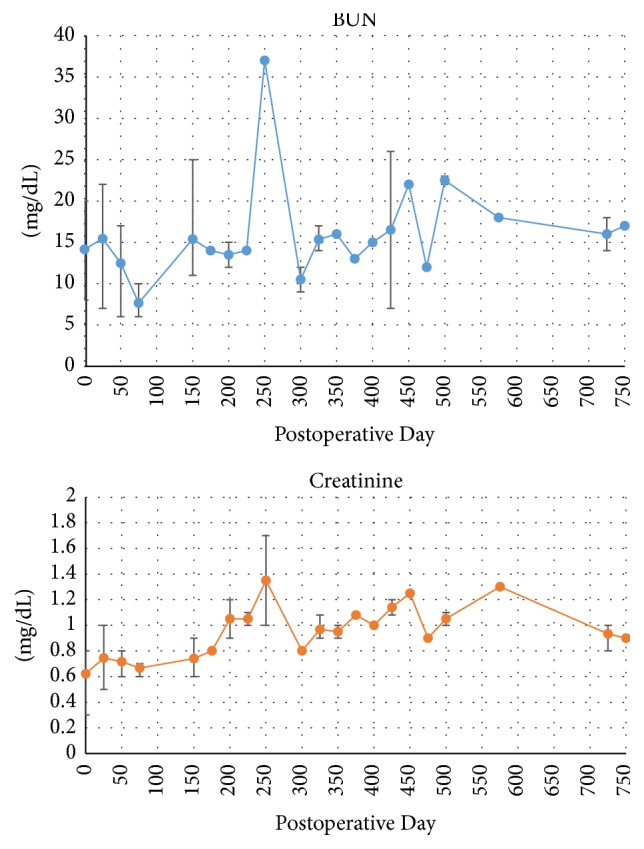
Patient's posttransplant renal function represented by blood urea nitrogen (BUN) and creatinine levels. Bars represent range of values in a 25-day period; plotted points represent the mean value during the same time period.

Patient's posttransplant renal function represented by blood urea nitrogen (BUN) and creatinine levels. Bars represent range of values in a 25-day period; plotted points represent the mean value during the same time period.