
Figure 9.
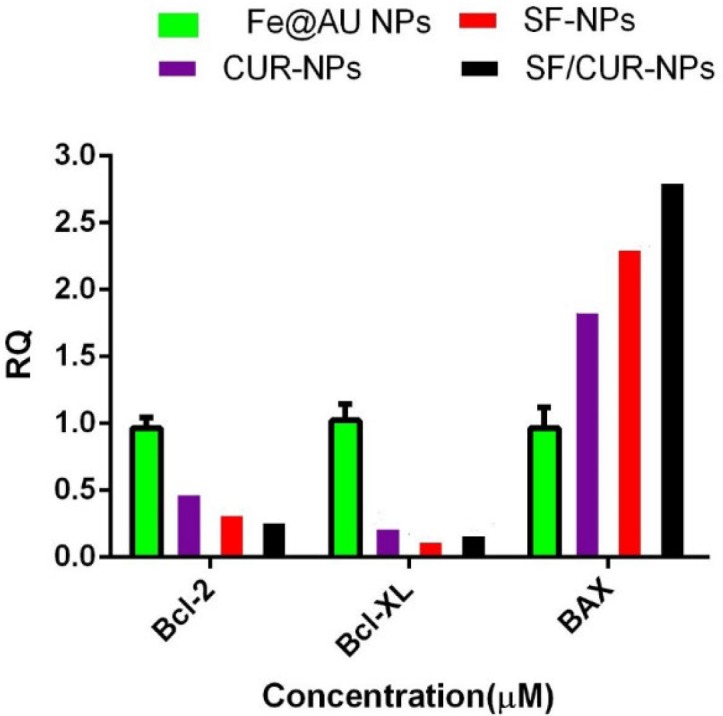
Statistical analysis of Real Time-PCR results by two-way ANOVA and Bonferroni posttest at the MCF-7 cells that were treated by SF/CUR-codelivery PEGylated Fe3O4@Au NPs nanoparticles, CUR-NPs, SF-NPs and Fe3O4@Au NPs as control. Mean ± SD. n=5. The symbols beside each group’s indicator present *P 0.1, **P 0.01,* **P 0.001 and****P 0.0001 significant difference against that control group