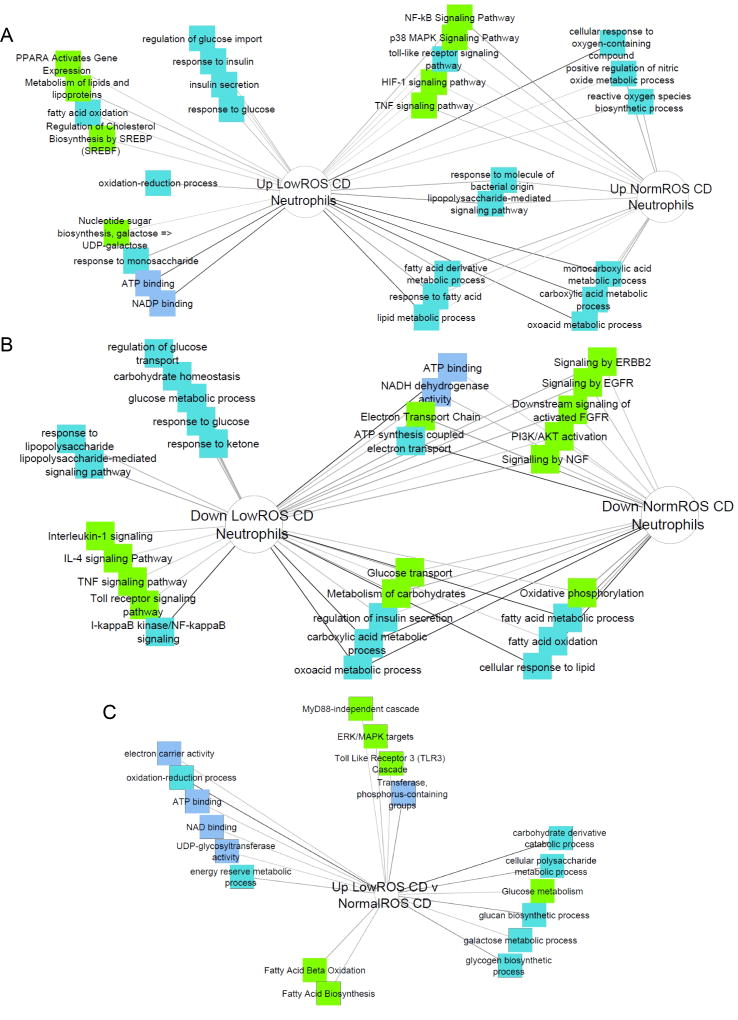
Figure 3. Metabolic and Immune Functions Differentially Expressed in CD Neutrophils with Normal and Low ROS Production.
Candidate gene prioritization through functional enrichment analysis, using genes differentially regulated between normal ROS CD neutrophils and controls as the test set and a glycolysis gene list as the training set, ranked test genes in the order of their importance in context of glycolytic functions. Genes with significant glycolytic functional enrichment were submitted to ToppCluster to identify mechanistic enrichments. A) Pathways and mechanisms enriched in genes that were upregulated in low ROS CD neutrophils vs control neutrophils or normal ROS CD neutrophils vs control neutrophils with significant ranking in glycolysis candidate gene analysis (part of the first pipeline). B) Pathways and mechanisms enriched in genes that were downregulated in low ROS CD neutrophils vs control neutrophils or normal ROS CD neutrophils vs control neutrophils with significant ranking in glycolysis candidate gene analysis (part of the first pipeline). C) Pathways and mechanisms enriched in genes that were upregulated in low ROS CD neutrophils vs normal ROS CD neutrophils with significant ranking in glycolysis candidate gene analysis (second pipeline).

