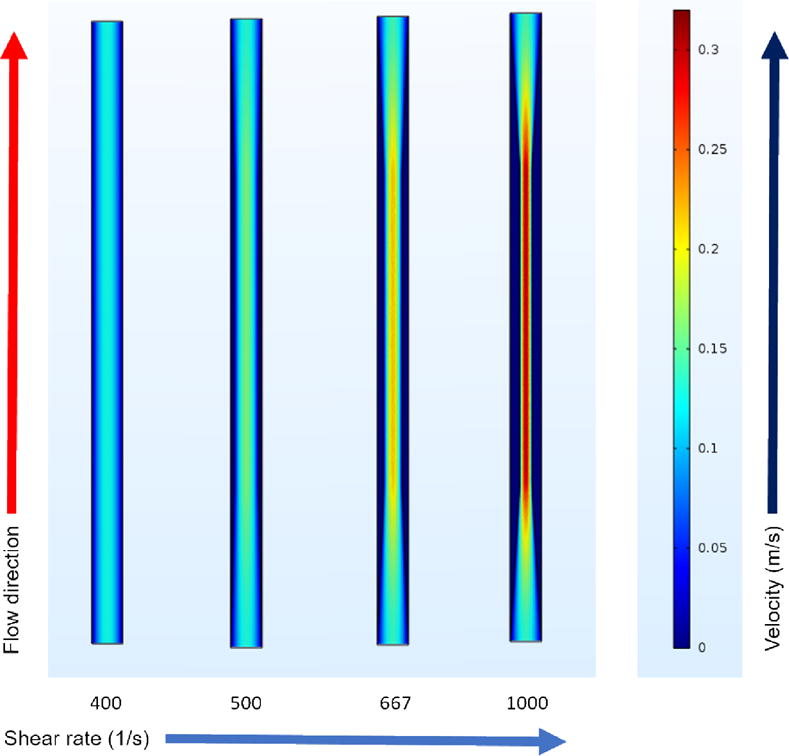
Figure 4.

Velocity profiles in four different flow chambers. The first 20 mm of each experimental flow chamber was simulated using COMSOL Multiphysics to visualize the velocity profiles in the anastomotic regions. The profiles show the velocity cross-section at the middle height of the channel (at the depth of 0.05 mm).
