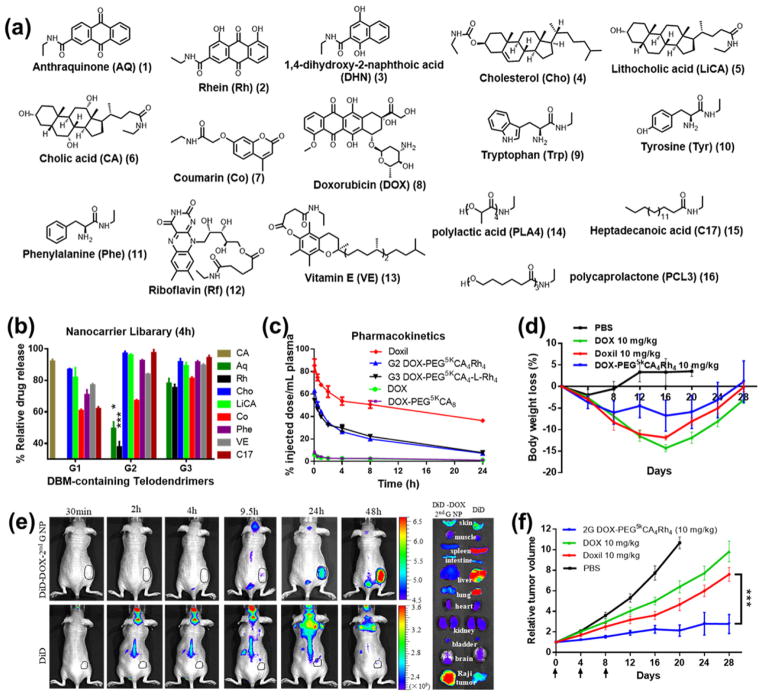
Fig. 8.
(a) Representative drug-binding molecules (DBMs) for doxorubicin (DOX). (b) Percentage of doxorubicin release from telodendrimer micelle library relative to the release rate of free doxorubicin and PEG5k CA8 at 4 h. (c) Pharmacokinetics profiles of doxorubicin concentration in plasma. (d) Body weight change of Raji lymphoma-bearing nude mice treated with different doxorubicin formulations. (e) In vivo and ex vivo near-infrared fluorescence optical images of Raji lymphoma-bearing nude mice injected intravenously with free DiD dye and DiD-doxorubicin-coloaded telodendrimer micelles. (f) In vivo tumor growth inhibition of Raji lymphoma-bearing nude mice treated with different doxorubicin formulations. Data were presented as mean±s.e.m. Student’s t-test: *P<0.05; **P<0.01; ***P<0.001. Reproduced with permission from ref. [17]. Copyright 2015 Nature Publishing Group.

