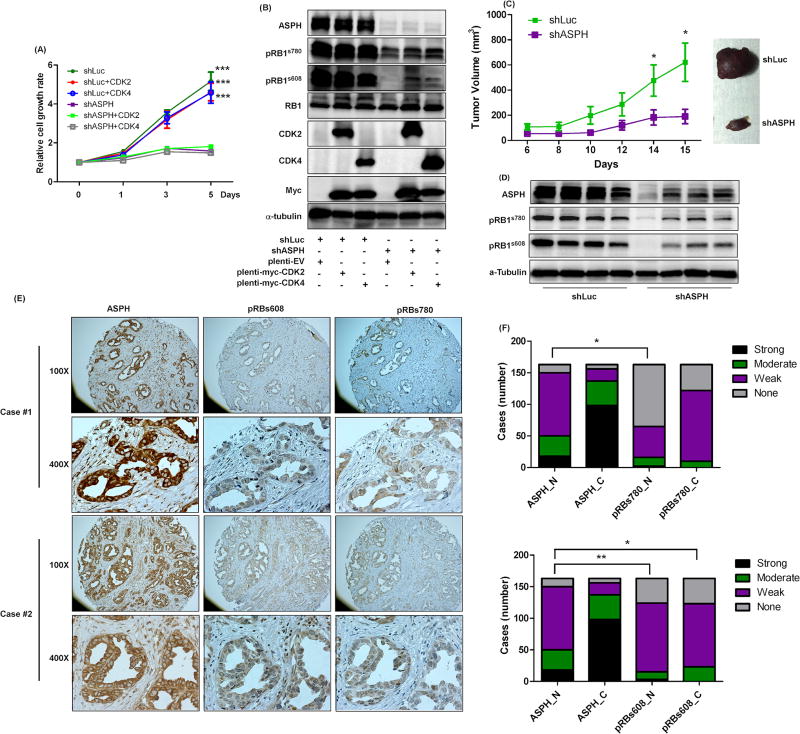
Figure 7. The correlations between ASPH, phosphorylated RB1, and CDKs in CCAs.
(A) Relative cell growth rates were determined in H1-shLuc and H1-shASPH transduced with plenti-myc-EV, plenti-myc-CDK2, or plenti-myc-CDK4 at days 0, 1, 3, and 5. (B) ASPH, pRB1s780, pRB1s608, RB1, CDK2, CDK4, myc, and α-tubulin were determined in H1 cells treated as indicated. (C) Tumor growth of H1-shLuc and H1-shASPH was evaluated in vivo by calculating tumor volumes of subcutaneous tumors implanted into nude mice. (D) The representative IB results of ASPH, pRBs780, pRBs608, and α-tubulin were obtained in the WCL harvested from the tumors of experimental nude mice. (E) The representative images (100× and 400×) of ASPH, pRBs608, and pRBs780 are shown in 2 cases of human patients with CCA tumors. (F) The intensities of nuclear ASPH, cytoplasmic ASPH, nuclear pRB1s780, cytoplasmic pRB1s780, nuclear pRB1s608, and cytoplasmic pRB1s608 were determined in human CCA samples, n=163. *, p<0.05; **, p<0.01; ***, p<0.001. The student t test was used to analyze statistical difference for (A) and (B). The Kendall tau-b rank test was used to evaluate if ASPH, pRB1s608, and pRB1s780 have significant correlation in human CCA tumors tested for (F).

