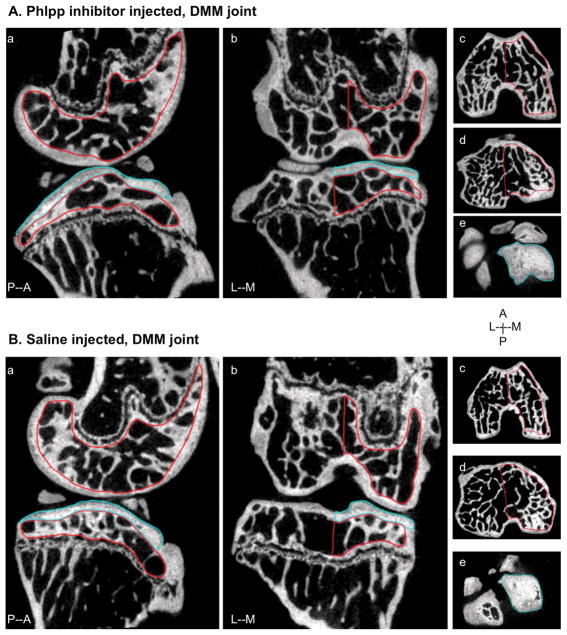
Figure 5. MicroCT images of subchondral bone in mice subjected to DMM.
2D images of DMM knee joints injected with NSC117079 (A) or saline (B) from lateral (a) and frontal (b) views. Regions of subchondral trabecular bone were analyzed from the medial (M) side of the distal femur (c) and proximal tibia (d) (outlined in red). Medial subchondral plate of the tibia was analyzed for mineralization and thickness and outlined in blue (e). Posterior (P), Anterior (A), Medial (M) and Lateral (L) directions are indicated.

