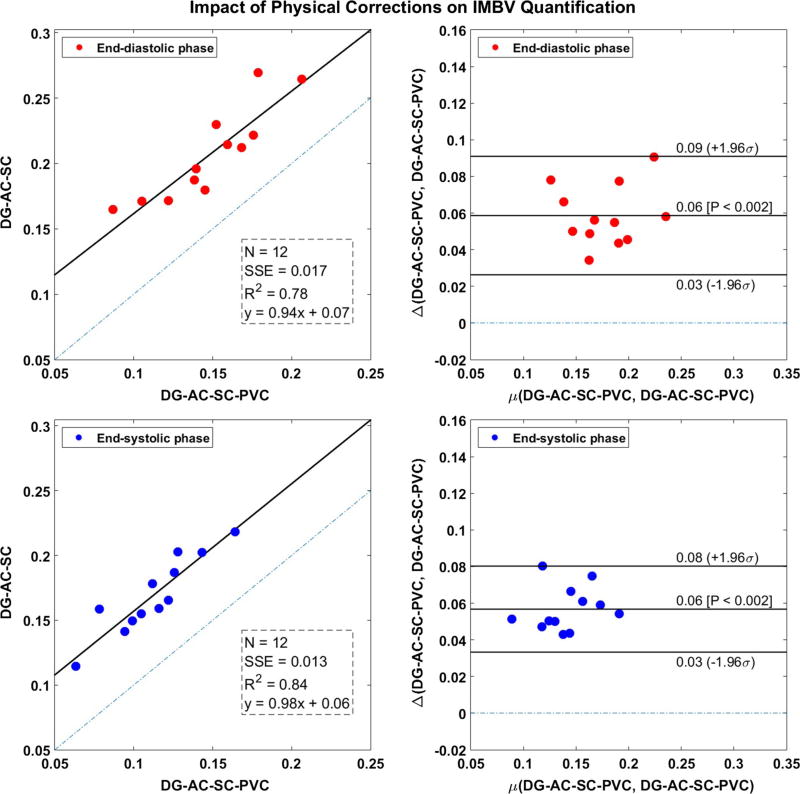
Figure 5.
Scatter and Bland-Altman plots of IMBV (end-diastolic and end-systolic phases) comparing DG + AC + SC and DG + AC + SC + PVC correction schemes. Scatter plots also display the sum of squared error (SSE), Pearson correlation-value squared (R2), and the slope/intercept of linear regression fit. Bland-Altman plots show lines of 95% confidence intervals (mean ± 1.96σ). µ(a, b) computes the mean of its arguments and Δ(a, b) computes the difference of its arguments (a – b). P < 0.05 was considered statistically significant.

