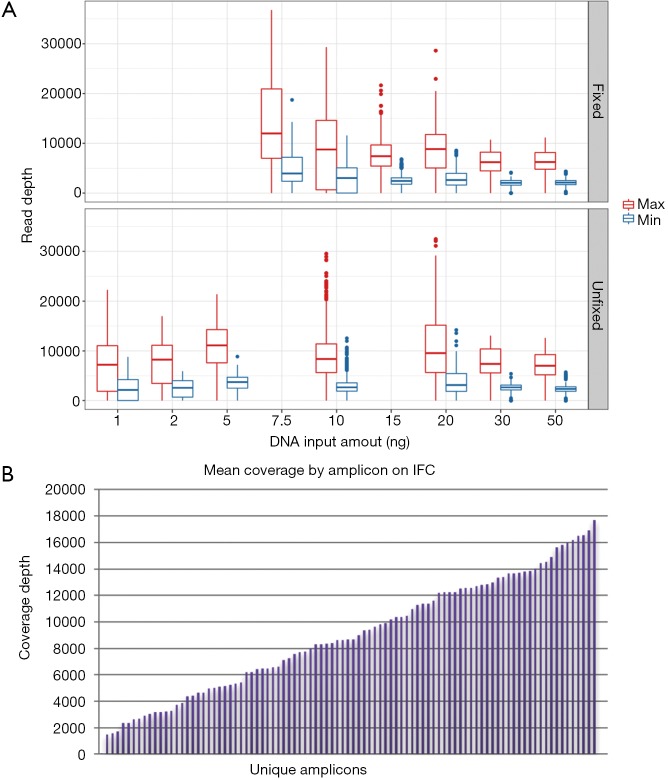
Figure 3.
Characterization of sequencing depth by sample type, input amount, and across individual PCR amplicons. (A) Box plots demonstrate the distribution of maximum (red) and minimum (blue) read depth for both formalin fixed (upper) and unfixed (lower) specimens at indicated DNA mass inputs using the integrated fluidics circuit (IFC) library preparation; (B) mean coverage by amplicon for fixed samples with 15 ng of DNA input on the IFC.

