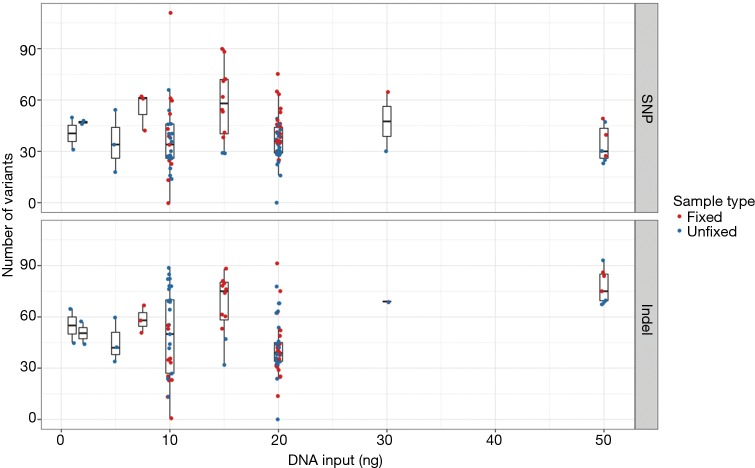
Figure 4.
Distribution of the total number of variants called per sample with IFC library preparation at various DNA inputs. Box plots show the distribution in the total number of single nucleotide variants (upper) and indel (lower) variants called for both fixed (red) and unfixed (blue) specimens at the indicated DNA inputs. A total of 115 replicates from 30 biologically unique samples are represented. IFC, integrated fluidics circuit.

