
FIGURE 4.
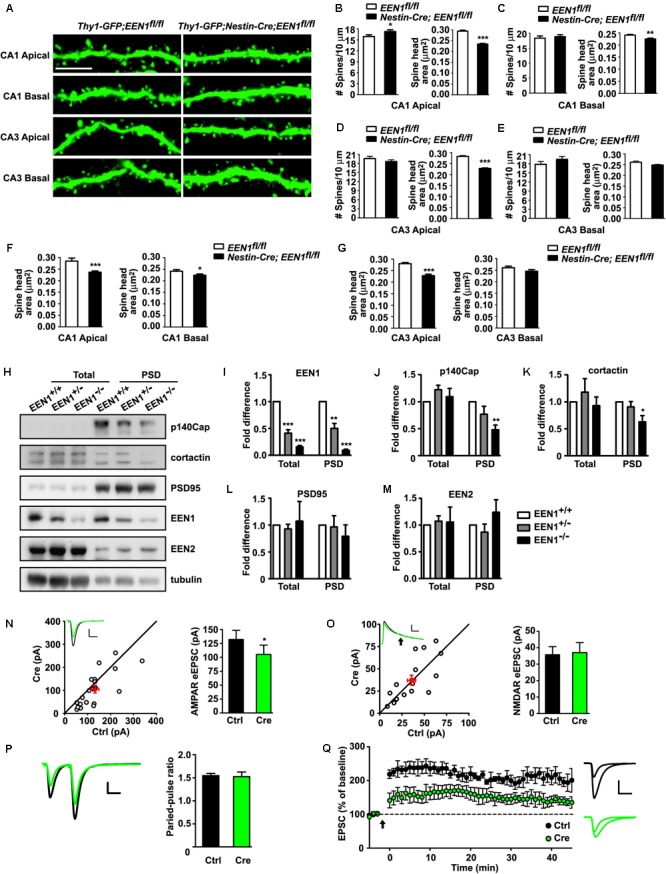
Morphological and functional alterations of EEN1-deficient hippocampal neurons. (A) Confocal micrographs showing spines on GFP-positive apical or basal dendrites of pyramidal cells in hippocampal CA1 or CA3 regions of 10-week-old Thy1-GFP;EEN1fl/fl and Thy1-GFP;nestin-Cre;EEN1fl/fl mice. Scale bar, 5 μm. (B–E) Quantification of spine density or spine head area in A (CA1 apical/basal: 42/34 cells, 2691/3240 spines, total length of dendrites >1500 μm and CA3 apical/basal: 32/31 cells, 2742/2258 spines, total length of dendrites >1000 μm for Thy1-GFP;EEN1fl/fl. CA1 apical/basal: 44/37 cells, 3666/2282 spines, total length of dendrites >1200 μm, and CA3 apical/basal: 39/32 cells, 3998/3002 spines, total length of dendrites >1500 μm for Thy1-GFP;Nestin-Cre;EEN1fl/fl). Data represent mean ± SEM, ∗p < 0.05, ∗∗p < 0.01, ∗∗∗p < 0.001. (F–G) Shown are the average of average spine head area of each CA1 and CA3 pyramidal cells, respectively. Data represent mean ± SEM, n = 31–44, ∗p < 0.05, ∗∗∗p < 0.001. (H) Immunoblotting of indicated proteins in homogenates (total) and PSD fractions from hippocampi of EEN1+/+, EEN1+/-, and EEN1-/- mice. (I–M) Quantification of protein levels in H, normalized to levels of EEN1+/+ mice. Data represent mean ± SEM, N = 4, ∗p < 0.05, ∗∗p < 0.01, ∗∗∗p < 0.001. (N) Dual recording analysis of AMPAR-mediated synaptic responses. Scatter plots show amplitudes of AMPAR-eEPSCs for single pairs (open circles) and mean ± SEM (filled circle). The current amplitudes of infected neurons (Cre) were plotted on the ordinate and those of the control neurons (Ctrl) were plotted on the abscissa. Inset shows sample current traces from a pair of infected (green) and control (black) neurons. Scale bar, 100 pA and 20 ms. Bar graph shows mean ± SEM of AMPAR amplitudes represented in the scatter plots. Control, 132.1 ± 16.3 pA; Cre, 105.1 ± 16.8 pA, n = 20, ∗p = 0.030, paired t-test. (O) NMDAR-mediated eEPSC. Currents were recorded at +40 mV. Data were collected at 150 ms after electric stimulation (arrow), when the AMPAR-mediated EPSC had completely decayed. Scale bar, 50 pA and 50 ms. The NMDA eEPSCs were 35.7 ± 4.6 pA for control and 37.1 ± 5.7 pA for Cre-expressing neurons. n = 16, p = 0.74, paired t-test. (P) Paired-pulse recording of AMPAR eEPSCs. Two identical stimulus pulses were delivered in an interval of 50 ms and AMPAR eEPSCs were recorded at -70 mV. Left were sample traces of eEPSCs from a pair of infected and control neurons. Scale bar, 100 pA and 25 ms. The paired-pulse ratio (PPR) was the enhancement of the second eEPSC relative to the first eEPSC. Bar graph shows mean ± SEM of PPRs. Control, 1.55 ± 0.05; Cre, 1.53 ± 0.10, n = 10, p = 0.81, paired t-test. (Q) LTP was severely reduced in EEN1-deficient neurons. Relative amplitudes of AMPAR-eEPSCs (mean ± SEM) in control and Cre-expressing neurons before and after a whole-cell LTP-pairing protocol (arrow), Vm = 0 mV, 2 Hz SC stimulation for 90 s, normalized to average eEPSC amplitude prior to LTP induction. n = 10 decreased to 6 cells for control and n = 9 decreased to 6 cells for Cre-expressing neurons, respectively. Right shows sample traces of control and Cre before and 40 min after pairing. Sale bar: 100 pA and 20 ms. The potentiation ratio is significantly decreased in EEN1-deficient neurons 40 min after LTP induction, p = 0.020, t-test