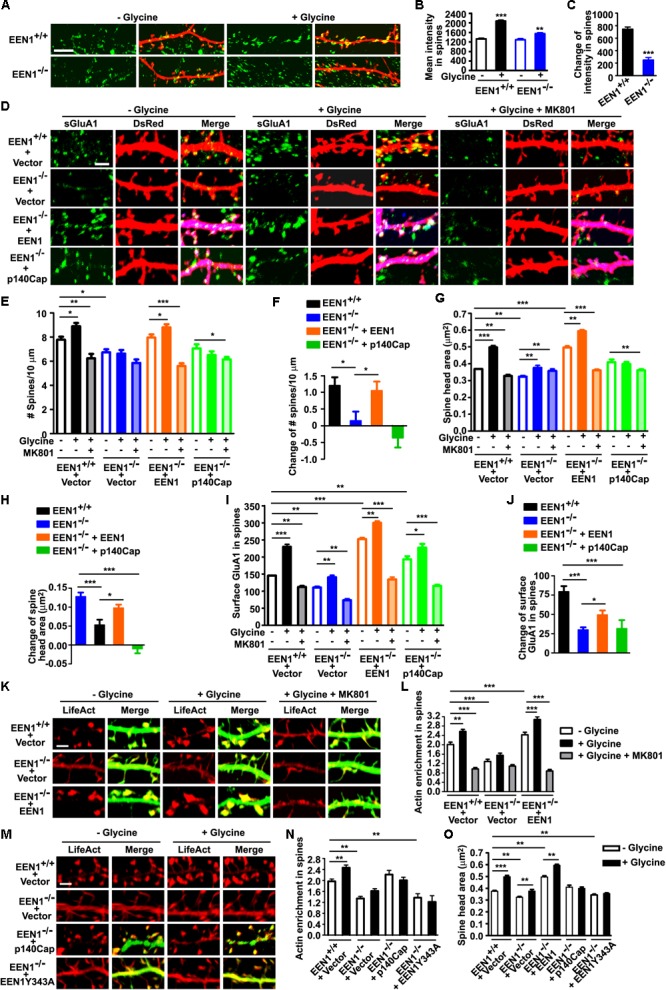
FIGURE 6.

EEN1 promotes actin polymerization in spines undergoing synaptic potentiation. (A) Cultured EEN1+/+ and EEN1-/- hippocampal neurons transfected with construct expressing DsRed on DIV12-13 were treated with glycine to induce LTP on DIV18, followed by immunostaining for p140Cap and DsRed. (B) Quantification of p140Cap mean intensity in spines in A. (C) Changes of p140Cap mean intensity in spines in A. Data represent mean ± SEM, n > 10 neurons, >500 spines per group, ∗∗p < 0.01, ∗∗∗p < 0.001. (D) Cultured EEN1+/+ and EEN1-/- hippocampal neurons co-transfected with DsRed construct and Flag vector, and EEN1-/- neurons co-transfected with constructs expressing DsRed- and Flag-tagged EEN1 or p140Cap on DIV12-13 were treated with glycine to induce LTP with or without MK801 pretreatment on DIV18, followed by immunostaining for surface GluA1, Flag, and DsRed. Shown are representative confocal images of dendrites. (E) Quantification of spine density in D. (F) Changes of spine density in D. (G) Quantification of spine head area in D. (H) Changes of spine head area in D. (I) Quantification of surface GluA1 levels in spines in D. (J) Changes of surface GluA1 levels in spines in D. Data represent mean ± SEM in E–J, n > 15 neurons, >850 spines per group, ∗p < 0.05, ∗∗p < 0.01, ∗∗∗p < 0.001. (K) EEN1+/+ neurons co-transfected with LifeAct–mCherry and GFP constructs, and EEN1-/- neurons co-transfected with LifeAct–mCherry and GFP or EEN1-GFP constructs on DIV12-13 were treated with glycine with orwithout MK801 pretreatment on DIV18, followed by immunostaining with antibodies against GFP and mCherry. Shown are representative confocal images of dendrites. (L) Quantification of actin enrichment in dendritic spines in K. Data represent mean ± SEM, n > 12 neurons, >700 spines per group, ∗∗p < 0.01,∗∗∗p < 0.001. (M) EEN1+/+ and EEN1-/- neurons co-transfected with LifeAct–mCherry construct and Flag vector, and EEN1-/- neurons co-transfected with LifeAct–mCherry and Flag-tagged p140Cap or EEN1 Y343A constructs on DIV12-13 were treated with glycine on DIV18, followed by immunostaining with antibodies against mCherry and Flag. Shown are representative confocal images of dendrites. (N) Quantification of actin enrichment in dendritic spines in M. (O) Quantification of spine head area in M. Data represent mean ± SEM in N and O, n > 10 neurons, >500 spines per group, ∗∗p < 0.01, ∗∗∗p < 0.001. Scale bars, 5 μm in A and 2 μm in D, K, and M
