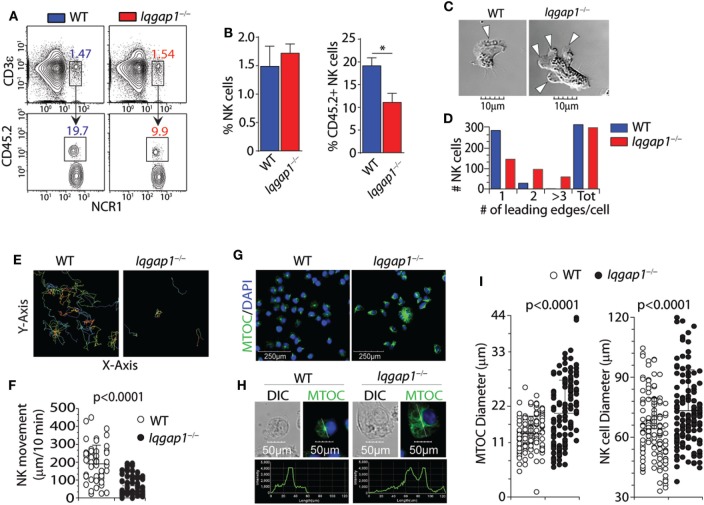
Figure 2.
Bone marrow (BM) localization, cell polarization, and motility of Iqgap1−/− natural killer (NK) cells. (A) Representative dot plots and (B) quantified percentages of CD45.2-labeled NK cells (CD3ε−NCR1+) illustrating sinusoidal (CD45.2+) vs. parenchymal (CD45.2−) localization within the BM of wild-type (WT) and Iqgap1−/− mice. (C) Representative images of IL-2-cultured WT and Iqgap1−/− NK cells showing the formation of lamellipodia at the leading edge and (D) quantification of the total number of leading edges per cell in >250 NK cells. (E) Traces of IL-2-cultured WT and Iqgap1−/− NK cells with the quantified movement of these cells over time as shown in panel (F). (G) Confocal microscopy of WT and Iqgap1−/− NK cells labeled with anti-tubulin antibody and counterstained with DAPI. (H) The intensity of tubulin fluorescence on a single-cell basis as well as quantification of microtubule organizing center (MTOC) and total NK cell diameter in 100 NK cells which are shown in (I). Error bars represent SD (B) or SEM (F,I) using three to four mice in at least two independent experiments, *p < 0.05 using two-tailed Student’s t-test.

