Figure 6.
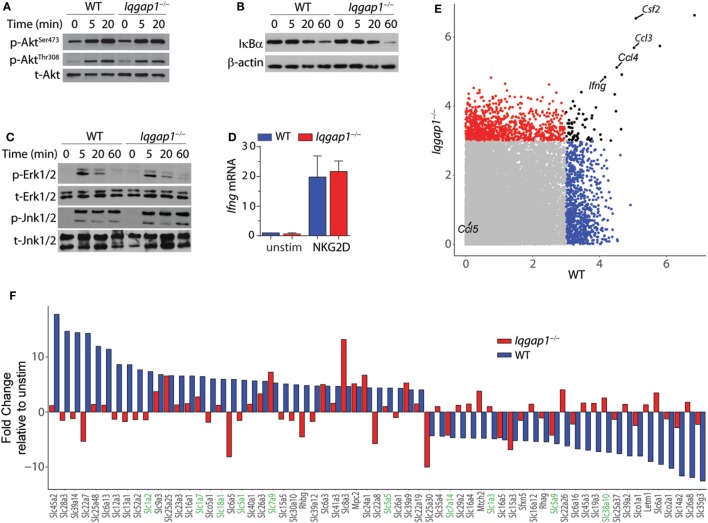
NKG2D signaling and induction of cytokine gene transcripts in Iqgap1−/− natural killer (NK) cells. (A) Phosphorylation of Akt at Ser473 and Thr308 was determined by western blot in NKG2D-stimulated wild-type (WT) and Iqgap1−/− NK cells at 20- and 60-min post-NKG2D activation and total Akt was used as the loading control (B) Degradation of IκBα is shown after activation with NKG2D in WT and Iqgap1−/− NK cells at indicated times post-activation with β-actin as the loading control. (C) Phosphorylation of mitogen-activated protein kinases, Erk1/2 (Thr202 and Tyr204), and Jnk1/2 (Thr183 and Tyr185), in WT and Iqgap1−/− NK cells are shown at indicated times post-NKG2D activation with total Erk1/2 and Jnk1/2 proteins serving loading controls. (D) Fold induction of Ifng transcript, relative to unstimulated WT NK cells, was determined by RT-qPCR 4-h post-NKG2D stimulation. (E) Microarray data represented by a scatter plot using a 3-Log2 fold change cutoff. NKG2D-induced cytokine transcripts are labeled. (F) Changes in the induction of solute carrier transcripts. Those that directly regulate amino acid transport are highlighted green. Error bars represent SD using four to five mice in at least two independent experiments (A–D) or four mice of each genotype pooled in one experiment (E,F).

