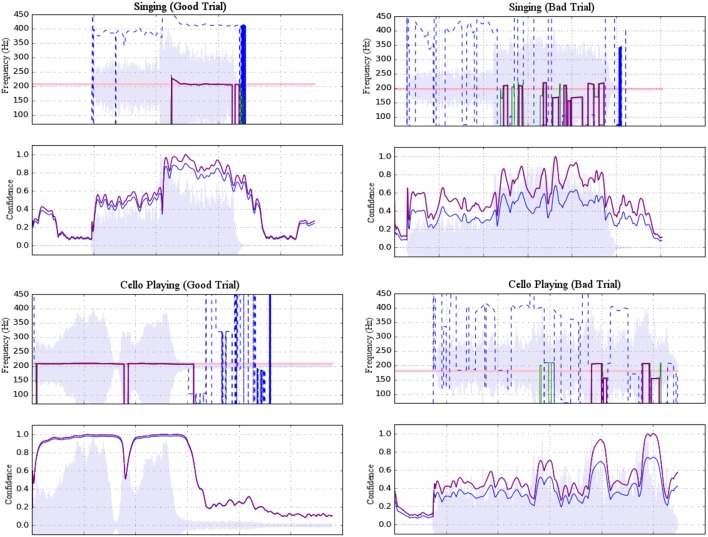
Figure 3.
Examples of accepted (left) and rejected (right) trials for both singing (top) and cello playing (bottom). Each example shows a plot of pitch estimations above a plot of confidence ratings. For the former, dashed blue lines represent raw pitch estimation whereas solid purple lines represent potentially stable pitch estimates adjusted to the fundamental. For the latter, raw confidence ratings are shown in blue and normalized confidence ratings are shown in purple. Shading indicates amplitude envelope.

