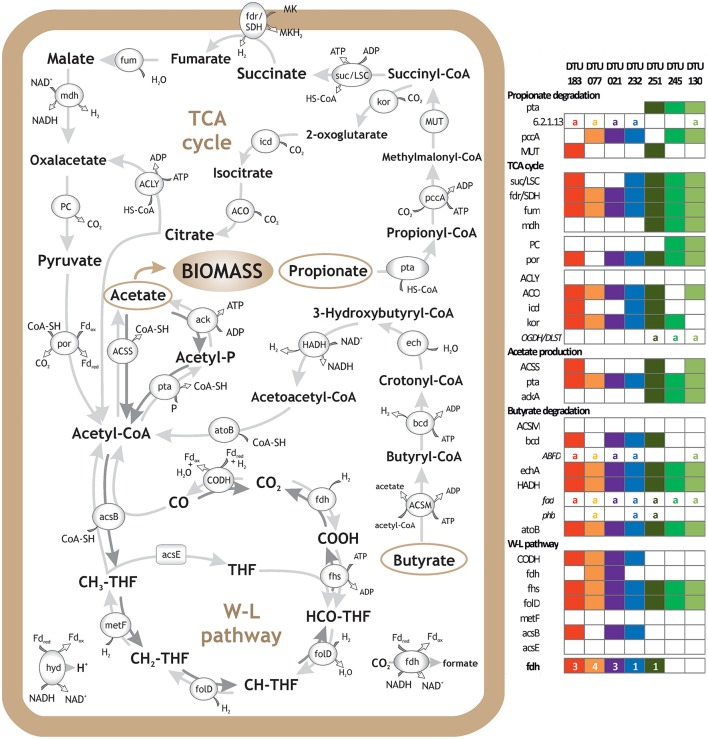
Figure 3.
Metabolic reconstruction of syntrophic bacteria. Schematic representation of VFA degradation and H2 and CO2 utilization, including Propanoate and Butanoate degradation, TCA cycle and WL pathway. Genes' presence in selected PGs is reported in the right panel. The selection of the PGs was based on their relevance with the aforementioned pathways and importance for the upgrading process; “a” letter indicates alternative pathway and numbers indicate gene isoforms or subunits of the multiprotein complexes. Clostridia sp. DTU183 gene content is depicted in red (potential homoacetogen); Clostridia sp. DTU077 gene content is depicted in orange (potential homoacetogen); Clostridia sp. DTU021 gene content is depicted in purple (potential SAOB); Syntrophomonadaceae sp. DTU232 gene content is depicted in blue (potential SAOB); Proteobacteria sp. DTU251 gene content is depicted in dark green (potential propionate/butyrate degrader); Firmicutes sp. DTU245 gene content is depicted in green (potential propionate degrader); Corynebacterium sp. DTU130 gene content is depicted in light green (potential propionate/butyrate degrader).

