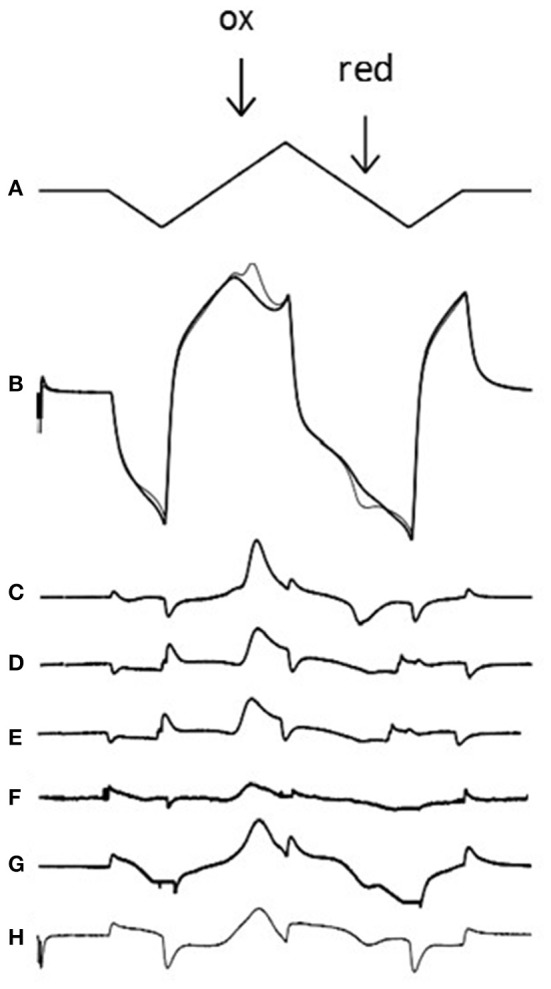
Figure 2.

Voltammetric technique and voltammograms for exogenous and endogenous amines. (A) The applied voltage to the carbon electrode (0 to −1 to +1.4 to −1 and back to 0 V at 480 V/s which takes 20 ms). (B) The charging current at the electrode in the absence (thick line) and presence (thin line) of 5 μM dopamine; note the dopamine oxidation peak (ox; 0.6 V) where dopamine releases 2 electrons, creating a Faradaic current. Note also the reduction peak (red; −0.2 V) where dopamine-o-quinone is reduced back to dopamine, using 2 electrons. If one subtracts the signal in the presence of dopamine from the signal in the absence of dopamine one is left with a voltammogram (C). Voltammograms are also shown for 5 μM noradrenaline (D), stimulated dopamine in the accumbens (E), and stimulated noradrenaline in the BNST (F). The voltammogram from the apparent ethylphenidate (30 μM) evoked increase in basal accumbens dopamine (see Figure 3C) is shown in (G), but the voltammogram from the calibration of the electrode in 30 μM ethylphenidate (see Figure 3D) reveals that this drug is electroactive (H). In each case the oxidation peak is clearly seen. Note that we often get small non-biological artifacts when the voltage changes direction. Neither methylphenidate nor 3,4-CTMP were found to be electroactive (data not shown).
