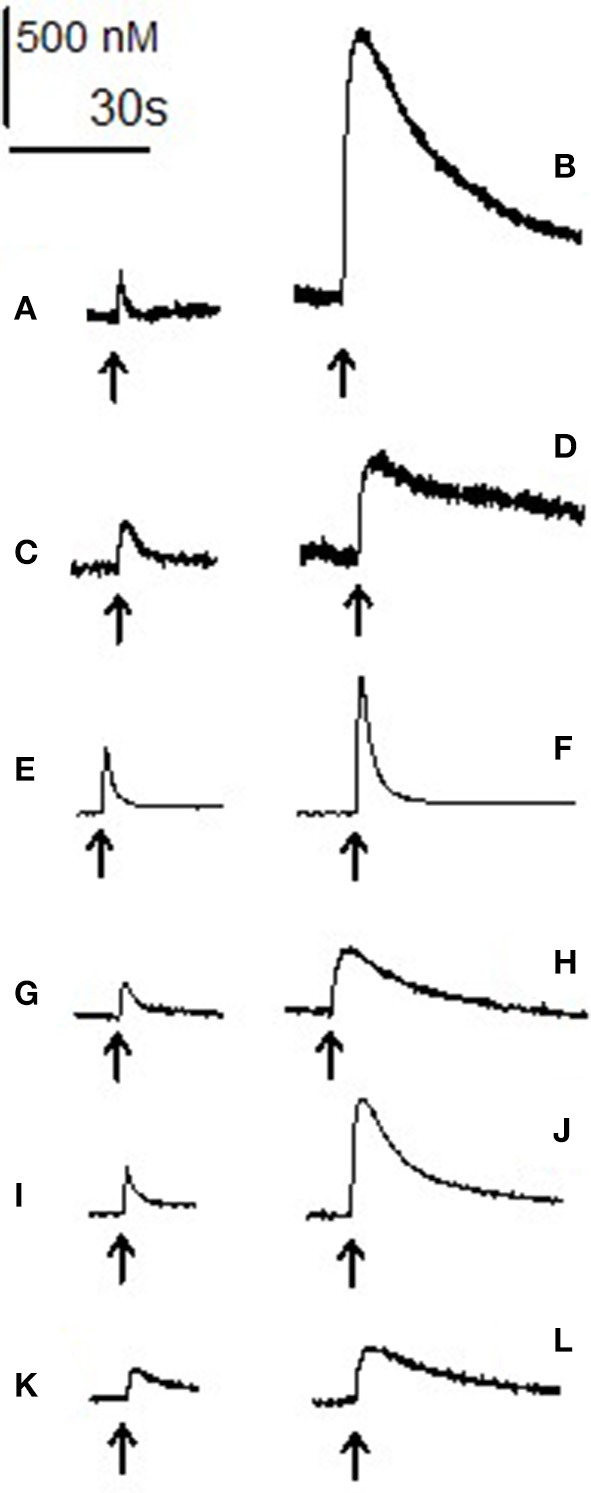
Figure 4.

Electrically evoked dopamine and noradrenaline: raw data. Each trace shows the increase in amine level after electrical stimulation (arrow) and its subsequent reuptake in the absence (left) and presence (right) of the three psychostimulant drugs. (A) Baseline stimulation in accumbens and (B) stimulation after 60 min of 10 μM 3,4-CTMP. (C) Baseline evoked efflux in the BNST and (D) after 60 min of 10 μM 3,4-CTMP. (E) Baseline evoked efflux in the accumbens and (F) after 60 min of 10 μM ethylphenidate, (G) baseline evoked efflux in the BNST and (H) after 60 min of 10 μM ethylphenidate. (I) Baseline evoked efflux in the accumbens and (J) after 60 min of 10 μM methylphenidate, (K) baseline evoked efflux in the BNST and (L) after 60 min of 10 μM methylphenidate. All traces are scaled such that the bars denoting concentration and time are accurate for each trace. The 2 traces in each pair (A and B; C and D; E and F; G and H; I and J; K and L) were taken from the same brain slice.
