FIGURE 4.

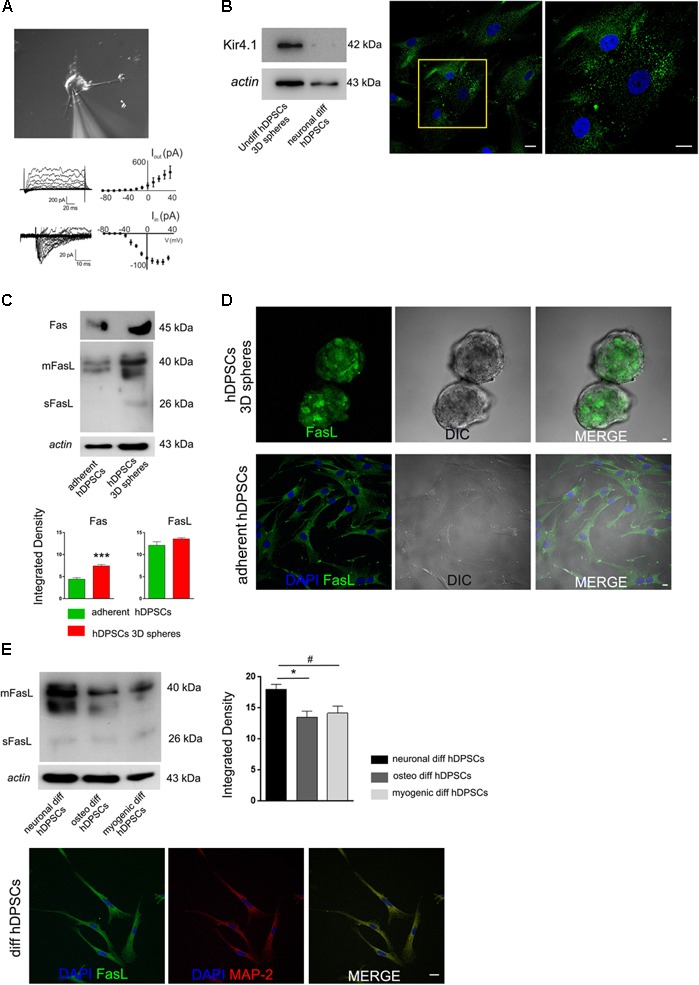
(A) Intracellular patch-clamp recordings performed on neuronal differentiated hDPSCs. Cells exhibit large outward (Iout) and tiny inward transient currents (Iin). Inward transient currents showing a small amount of currents at the peak of activation and kinetics compatible with transient sodium currents. Outward currents displaying larger values at the peak and kinetics compatible with currents produced by voltage-dependent potassium channels, responsible of action potential repolarization. (B) Western blot analysis (left) of Kir4.1 in undifferentiated 3D-derived hDPSCs and in hDPSCs following neuronal commitment. Immunofluorescence analysis against Kir4.1 was performed on undifferentiated STRO-1+/c-Kit+/CD34+hDPSCs following 3D culture (right). High magnification is referred to yellow insert. (C) Western blot analysis of Fas and FasL, and (D) immunofluorescence analysis of FasL expression were carried out on undifferentiated hDPSCs, cultured either as floating spheres or under adherent conditions. Densitometry of Fas and FasL bands is shown at the bottom (∗∗∗P < 0.001, Fas expression in hDPSCs 3D spheres vs. adherent hDPSCs). No statistically significant differences were reported for FasL expression between the two culture conditions. (E) Western blot analysis of FasL performed on hDPSCs induced toward neuronal, osteogenic and myogenic lineages, respectively. Actin bands were presented as control of protein loading. Densitometric analysis revealed that FasL expression was higher following induction of neuronal commitment in hDPSCs, when compared to osteogenic and myogenic commitments (∗P < 0.05 vs. osteogenic diff hDPSCs, #P < 0.05 vs. myogenic diff hDPSCs). Immunofluorescence analysis on differentiated hDPSCs showed FasL expression following induction to neuronal commitment, as demonstrated by positive immunolabeling against MAP-2 and FasL. Bar: 10 μm.
