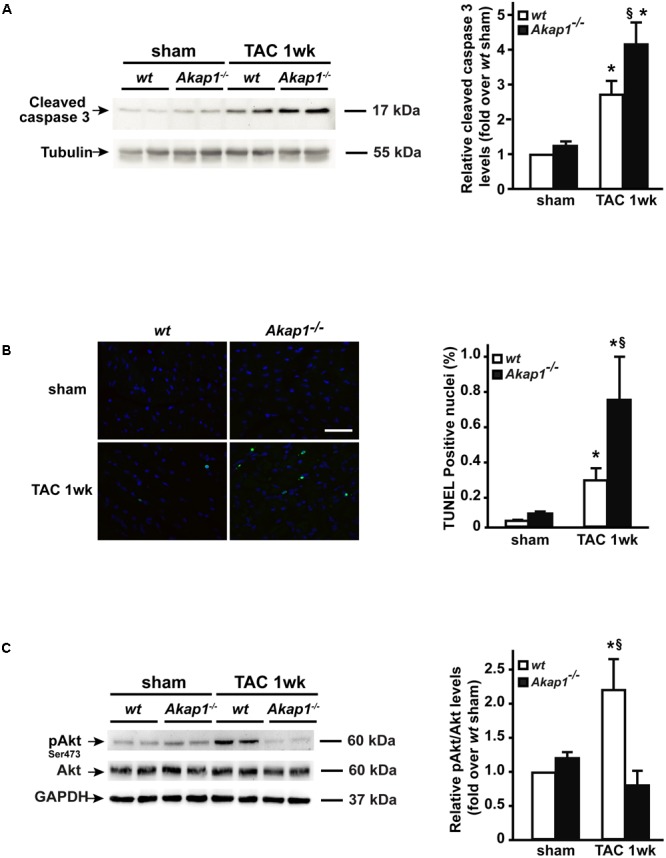
FIGURE 4.

Increased cardiac apoptosis and lack of Akt activation in Akap1-/- mice after TAC. (A) Representative immunoblot (left) and densitometric analysis (right) of cleaved caspase-3 protein levels in wt and Akap1-/- hearts 1 week after sham or TAC procedure (∗p < 0.05 vs. sham; §p < 0.05 vs. wt TAC 1w; n = 5 hearts/group). Tubulin was used as control of loading sample. (B) (Left) Representative DAPI and TUNEL staining of cardiac sections from wt, Akap1+/-, and Akap1-/- mice 1 week after sham or TAC procedure. Positive nuclei appear green. Scale bar: 20 μm. (Right) Bar graphs showing cumulative data of multiple independent experiments evaluating TUNEL-positive cells (∗p < 0.05 vs. sham; §p < 0.05 vs. wt TAC 1w; n = 5 hearts/group). (C) Representative immunoblot (left) and densitometric analysis (right) of Akt Ser 473 phosphorylation (pAkt) and Akt in wt and Akap1-/- hearts 1 week after sham or TAC procedure. GAPDH was used as control of loading sample (∗p < 0.05 vs. sham; §p < 0.05 vs. Akap1-/- TAC 1w; n = 5 hearts/group).
