Fig. 3.

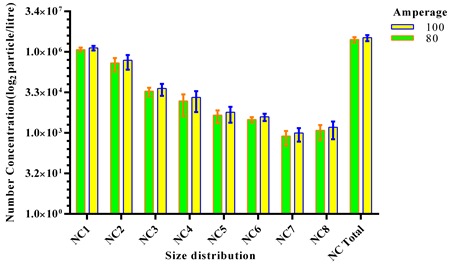
Comparison of number concentration (NC) of fumes in various size distribution in 80 and 100 amps with error range (shown as red and blue lines).

Comparison of number concentration (NC) of fumes in various size distribution in 80 and 100 amps with error range (shown as red and blue lines).