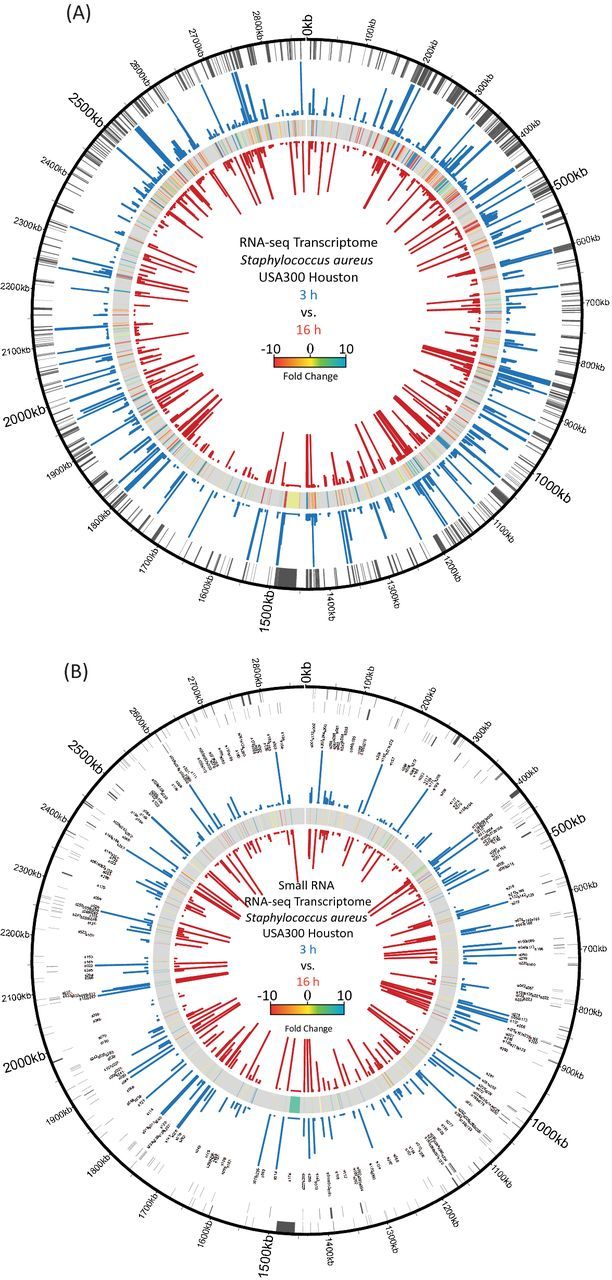
Figure 2.

Genomic maps depicting transcriptomic changes during exponential and stationary phase growth of S. aureus. (A) For protein-coding genes, the chromosomal location (outer circle) as well as expression values for exponential (blue bars) and stationary phase (red bars) cultures are displayed. In between expression values, transcriptional fold changes are shown. For increased accessibility, the figure contains only genes that showed a ≥ ±3-fold alteration in expression. (B) sRNA annotations are shown in sense (outer circle) and antisense (second circle) directions, along with the corresponding gene names. The RPKMs for exponential (blue bars) and stationary (red bars) cultures, as well comparative fold changes (in between), are shown. For both transcriptome figures, the cutoff for expression strength displayed is 1000 RPKM, with genes higher than this displayed as 1000 in order to make lowly expressed genes more visible.
