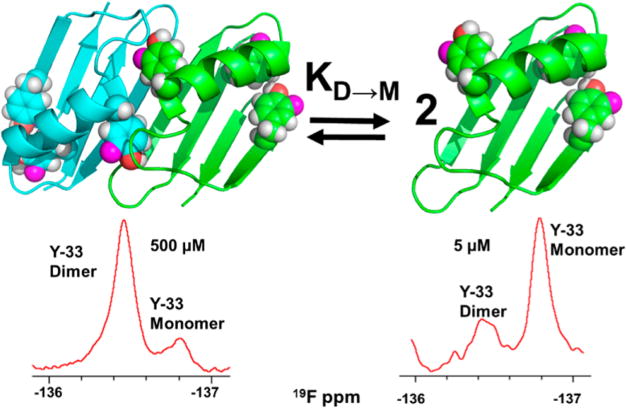
Figure 1.

A34F GB1 dimer and monomer and 19F NMR spectra acquired at two concentrations. In each spectrum, the area under a peak is proportional to the concentration of the corresponding state, allowing straightforward quantification of the dissociation constant, KD→M.
