Figure 3.

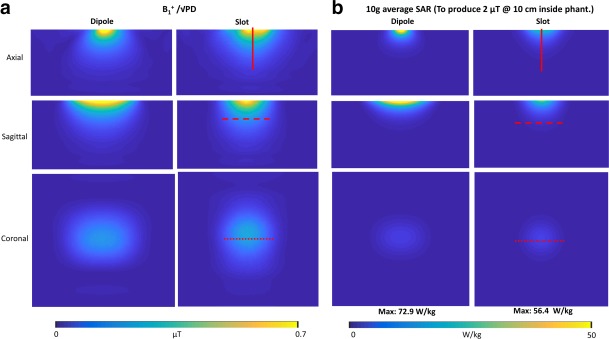
Normalized maps (A) and 10g average SAR maps (B) for axial and sagittal slices at the center of the antenna, and a coronal slice 10 cm inside the phantom.

Normalized maps (A) and 10g average SAR maps (B) for axial and sagittal slices at the center of the antenna, and a coronal slice 10 cm inside the phantom.