Figure 4.

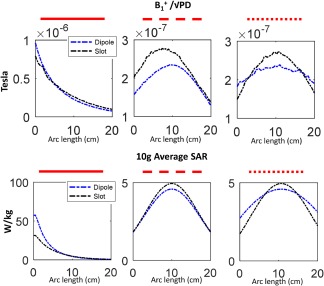
1D projections of the normalized maps and 10g average SAR maps (denoted in red lines in Figure 3) for the slot (black) and dipole (blue) antennas.

1D projections of the normalized maps and 10g average SAR maps (denoted in red lines in Figure 3) for the slot (black) and dipole (blue) antennas.