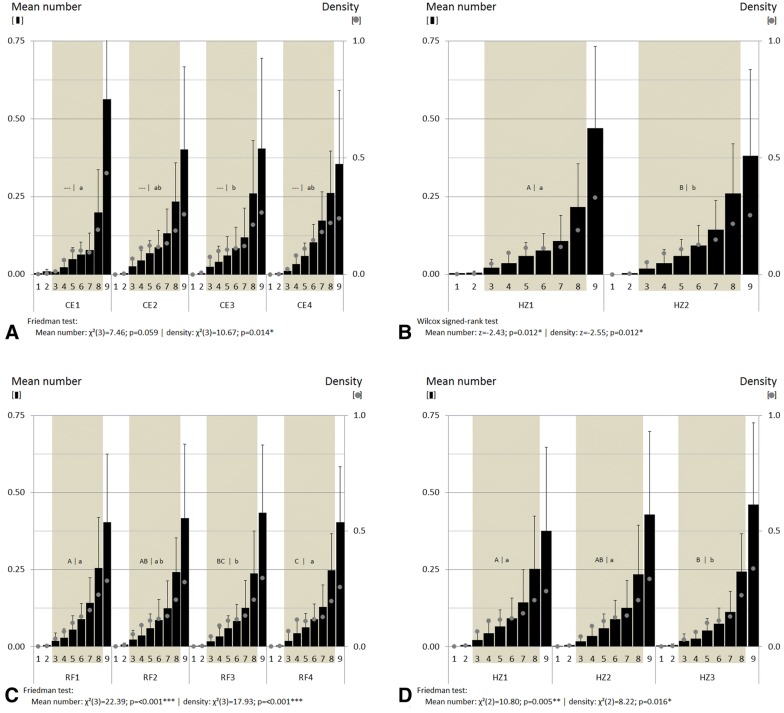
Fig. 6.
Mean number (columns) and density (points; mean number/class area) of oil droplets, determined from root thin section slices of valerian and allocated in nine classes (1–9). Shown are four cloned elites (CE1, CE2, CE3, CE4) (A), two root classifications (thin- and thick-rooted) (B), four root diameter fractions (RF1, RF2, RF3, RF4) (C) and three root horizons (HZ1, HZ2, HZ3) (D). Vertical lines: standard deviation. Significant codes: *< 0.05, **< 0.01, ***< 0.001. The same capital and small form letters mark that the oil droplet mean numbers and the densities are equal (p < 0.05, SNK), respectively. The colored background marks the classes of the parenchyma. Further details of the cloned elites, the root classification, the root diameter fractions, the horizons and the parenchyma are shown in the text

