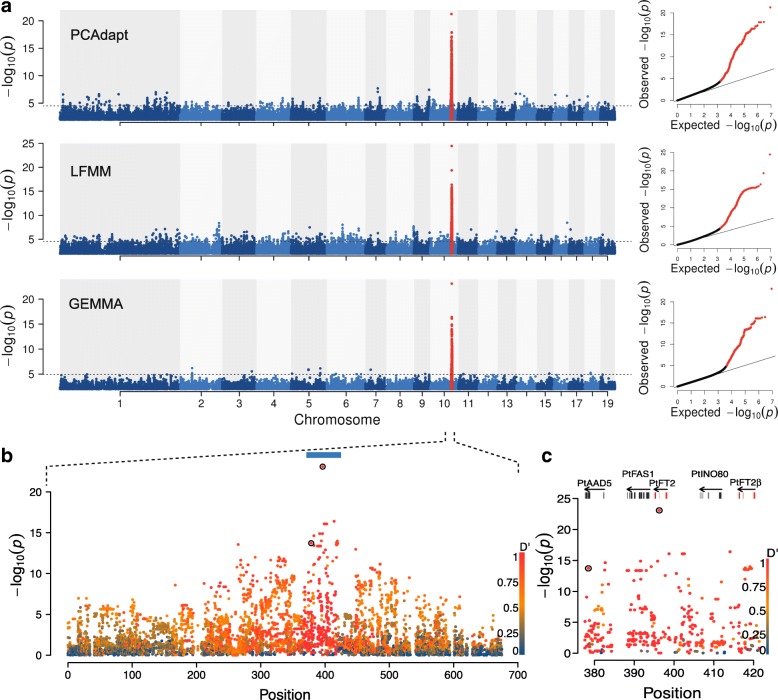
Fig. 2.
Local adaptation signals across the genome. a Manhattan plots for SNPs associated with population structure (PCAdapt), climate variation (LFMM), and phenotype (GEMMA). The 700-kbp region surrounding PtFT2 gene (marked in red) is identified by all methods. The dashed line represents the significance threshold for each method. Quantile-quantile plot is displayed in the right panel, with significant SNPs highlighted in red. b Magnification of the phenotype association results (from GEMMA) for the region surrounding PtFT2 on Chr10. The coordinates correspond to the region 16.3 Mbp-17.0 Mbp on Chr10. Individual data points are colored according to LD with the most strongly associated SNP (Potra001246:25256). The two potential causal variants identified by CAVIAR within this region are marked by black circles. c Close-up view of the phenotype association results (from GEMMA) in a region corresponding to the blue bar in (b). This region contains the two PtFT2 homologs (red - exons, blue - UTRs) and several other genes (dark gray - exons, light grey - UTRs)

