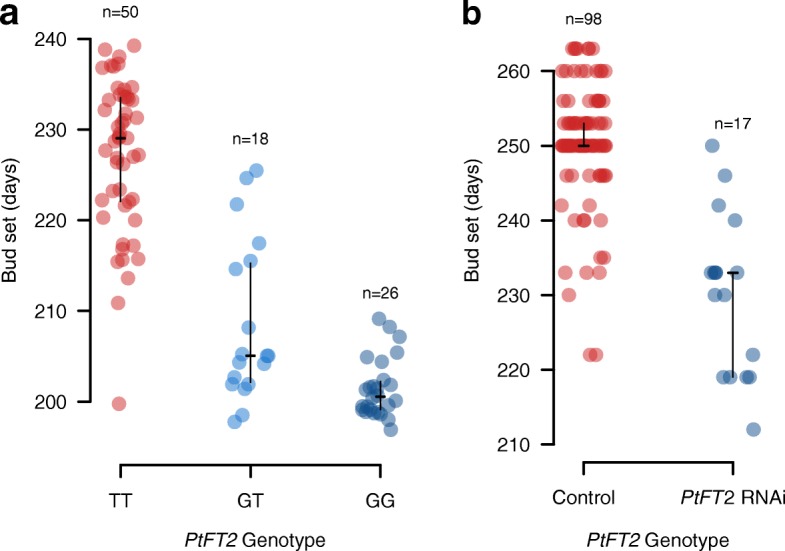
Fig. 6.

Phenotypic effects of PtFT2. a The timing of bud set for the three genotypes classes at the PtFT2 SNP (Potra001246:25256) that displays the strongest signal of local adaptation identified by all three methods as shown in Fig. 2a. The plot displays mean genotype bud set after correcting for common garden site, year, and block effects. The horizontal line indicates the median value and the vertical line marks the interquartile range. The number of genotypes in the respective classes is indicated above the figure. b The timing of bud set for wild type control lines and transgenic PtFT2 lines in the field experiments at Våxtorp. The structure of the plots is the same as in (a)
