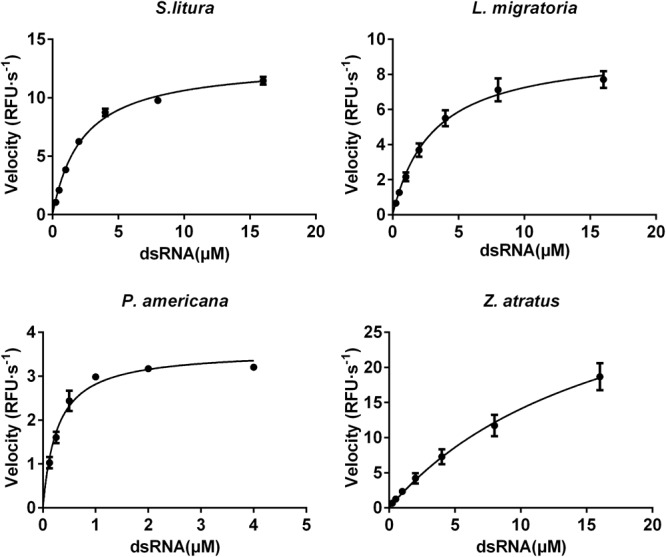
FIGURE 8.

Comparison of the saturation curves of the dsRNA degrading nuclease of four insects. The homogenates were prepared from whole body of different insects. The test reaction used the buffer with optimal pH and Mg2+ concentrations for different insect species (pH 10.0 and 8 mM Mg2+ for S. litura, pH 9.0 and 8 mM Mg2+ for the other three species). Different concentration of dsRNA substrates were incubated with 19 μL enzyme solutions in a total volume of 20 μL. The fluorescence intensity in different reactions were continuously monitored at 37°C. Values are mean ± SE; n = 3.
