Fig. 1.
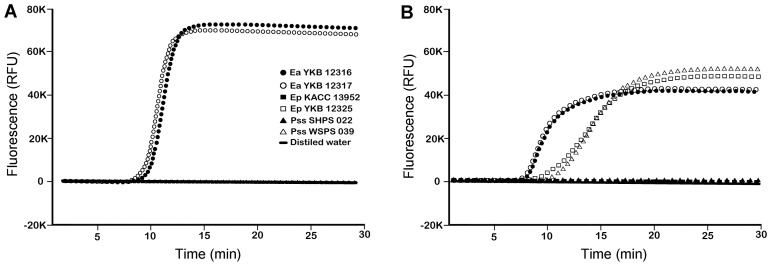
DNA amplification curves of representative strains of Erwinia amylovora (Ea), E. pyrifoliae (Ep), and Pseudomonas syringae pv. syringae (Pss) by DS-LAMP (A) and Bühlmann-LAMP (B) carried out with Genie III (OptiGene Ltd, West Sussex, UK). Purified genomic DNA (10 ng) was used; Ea YKB 12316 (black circle), Ea YKB 12317 (hollow Circle), Ep KACC 13952 (black square), Ep YKB 12325 (hollow square), Pss SHPS 022 (black triangle), Pss WSPS 039 (hollow triangle). Distilled water was as a negative control (black line).

