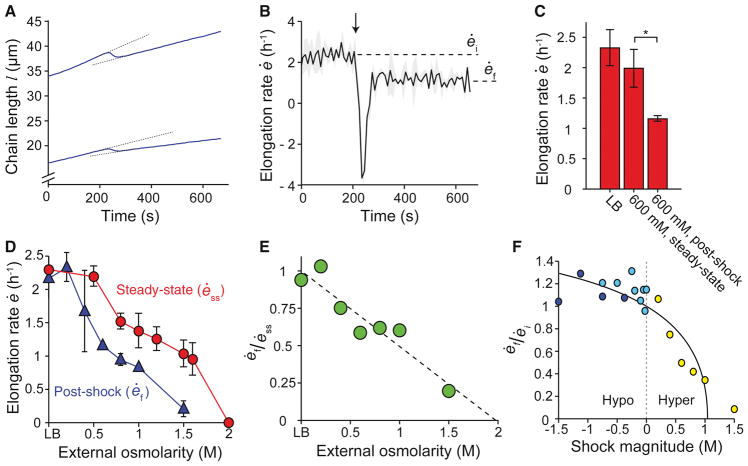
Figure 3. B. subtilis elongation rate is reduced by hyperosmotic shock.
(A,B) Response of cell length (A) and population-averaged elongation rate (B) of B. subtilis chains to hyperosmotic shock, from LB to LB + 600 mM sorbitol (n = 2). Arrows indicate the time of shock. Dotted lines in (A) illustrate that elongation rate after the shock (ėf) is lower than the steady-state elongation rate before the shock (ėi). Shading indicates ±1 s.d. (C) Comparison of the population-averaged steady-state elongation rate in LB (n = 6), the steady-state elongation rate in LB + 600 mM sorbitol (n = 4), and the elongation rate after a hyperosmotic shock from LB to LB + 600 mM sorbitol (n = 3). Error bars are 1 s.d. *: Student’s t-test, modified for small n, p < 0.05 (Methods). (D) Population-averaged elongation rate of B. subtilis cell chains at steady state and immediately after hyperosmotic shock from LB versus sorbitol concentration. (E) Ratio between the post-hyperosmotic shock elongation rate and steady-state elongation rate decreases linearly with increasing medium osmolarity. The dotted line is a linear best fit. (F) The ratio of post-shock to pre-shock elongation rate as a function of shock magnitude for hypoosmotic shocks from LB + 1 M sorbitol (dark blue circles), hypoosmotic shocks from LB + 1.5 M sorbitol (light blue circles), and hyperosmotic shocks from LB (yellow circles). The solid line is the prediction of the tension-inhibition model.

