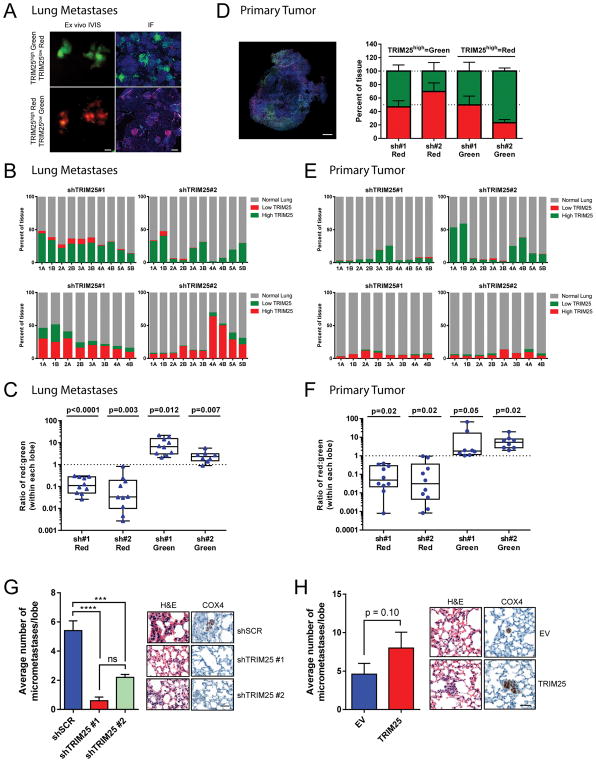
Figure 2.
TRIM25 affects the metastatic potential of TNBC cells. (A) Representative images of lungs isolated from athymic nude mice injected in the lateral tail vein with MDA-MB-231 cells infected with indicated constructs. Representative images of IVIS ex vivo fluorescence imaging with spectral unmixing (left, scale bar represents 5mm) and immunofluorescence (right, scale bar represents 100μm). (B) Quantification of (A) for each mouse separately. Numbers (1–5) denote different mice, A and B denote 1 left or 1 right lung lobe respectively. (C) Quantification of (A) by group. Data are represented as box and whiskers plot (min to max, centred value at median), n represents 8–10 biological replicates as indicated; p value represents pairwise t-test (two-tailed) for red vs. green. (D) Representative image and quantification of primary tumors isolated from NOD scid gamma mice injected in the mammary fat pad with MDA-MB-231 cells infected with indicated constructs. Scale bar represents 1mm. (E) Quantification of the lungs from (D) for each mouse separately. Numbers 1–5 denote different mice, A and B denote 1 left or 1 right lung lobe respectively. (F) Quantification of the lungs from (D) by group. Data are represented as box and whiskers plot (min to max, centred value at the median), n represents 8–10 biological replicates as indicated; p value represents pairwise t-test (two-tailed) for red vs. green. (G–H) Quantification and representative images of lungs from athymic nude mice injected in the lateral tail vein with CAL-51 cells infected with indicated constructs. Data are mean ± s.e.m., n=5 mice per group. Scale bar represents 50μm. See also Figure S3.

