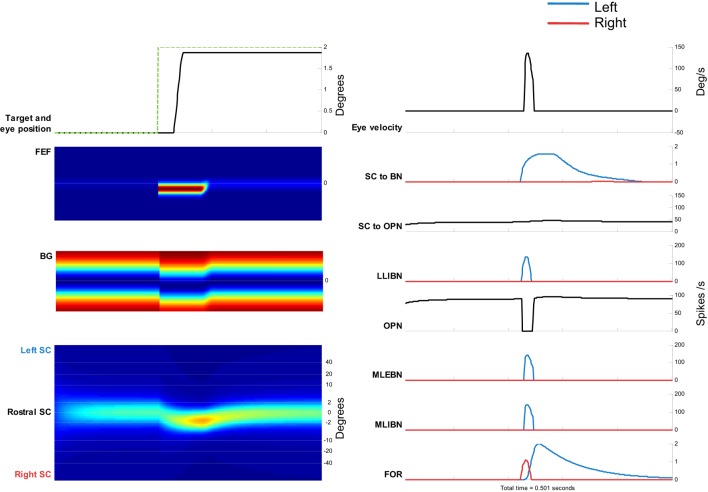
Figure 5.
Simulation of a 2° saccade toward the right. Left side, from top to bottom: target movement and simulated eye position. Frontal eye field (FEF) activity. Basal ganglia (BG) activity. Superior colliculus (SC) activity. Color plots show evolution of activity over time in each map. Top, neurons encoding leftward movements. Bottom, neurons encoding rightward movements. Right side, from top to bottom: eye velocity. Total projection from SC to burst neurons (BNs) (left BNs in blue and right BNs in red). Total projection from SC to omnipause neuron (OPN). Firing rate of long lead IBN (LLIBN), OPN, medium lead excitatory BN (MLEBN), medium lead IBN (MLIBN), and fastigial oculomotor region (FOR) (cerebellum).

