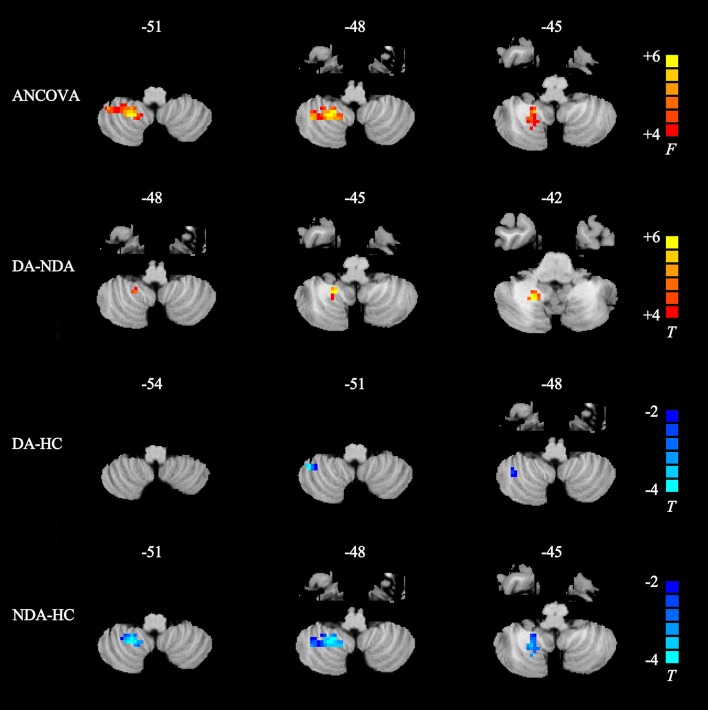
Figure 2.
Statistical maps showing rCBF differences in different brain regions between DA, NDA, and HC groups. ANCOVA, significantly increased in rCBF among DA, NDA and HC groups (P < 0.025, AlphaSim corrected); Higher rCBF was in the right cerebellum posterior lobe; the red color bar indicates the F-value from ANCOVA among three groups. DA-NDA, significantly increased in rCBF of DA patients compared with NDA patients (P < 0.025, AlphaSim corrected); the DA patients showed higher CBF in the right cerebellum posterior lobe; the red color bar indicates the t value from independent sample t-test between DA and NDA groups. DA-HC, significantly decreased in rCBF of DA patients compared with HC (P < 0.025, AlphaSim corrected); the DA patients showed lower rCBF in the right cerebellum posterior lobe; the blue color bar indicates the t value from independent sample t-test between DA and HC groups. NDA-HC, significantly decreased in rCBF of NDA patients compared with HC patients (P < 0.025, AlphaSim corrected); the NDA patients showed lower rCBF in the right cerebellum posterior lobe; the blue color bar indicates the t value from independent sample t-test between NDA and HC groups. ANCOVA, analysis of covariance; DA, depressed asthma; NDA, non-depressed asthma; HC, healthy controls.

