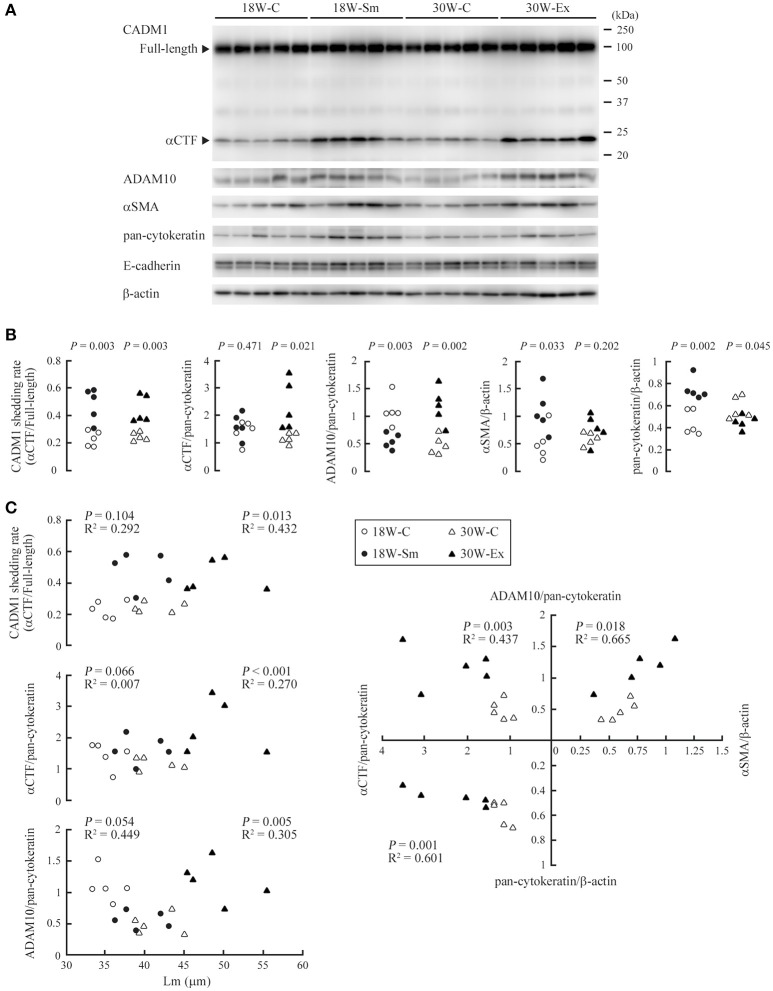
Figure 4.
Expressions of CADM1 and related molecules in ex-smoker model mouse lungs and their mutual correlations. (A) Protein was extracted from the lungs of 20 mice, each allocated to one of the four groups (18W-C, 18W-Sm, 30W-C, and 30W-Ex), and was subjected to Western blot analyses using an anti-CADM1 antibody. Arrowheads indicate bands corresponding to the full-length and αCTF forms of CADM1. The blot was reprobed with an anti-ADAM10, anti-αSMA, anti-pan-cytokeratin, and anti-E-cadherin antibody. The blot was also probed with an anti-β-actin antibody to indicate the amount of protein loading per lane. (B) CADM1 ectodomain shedding rates (amount of αCTF relative to full-length CADM1), αCTF and ADAM10 levels per lung epithelial cell (relative to pan-cytokeratin), and αSMA and pan-cytokeratin levels per tissue (relative to β-actin) are plotted as dots in each group. Statistical significance between the two groups of the same age was analyzed using paired Student's t-test. P-values are shown. (C) The CADM1 shedding rate, αCTF and ADAM10 level per epithelial cell are shown in the upper three scatter plots with Lm. In the right graph, the αCTF and ADAM10 levels per epithelial cell, and αSMA and pan-cytokeratin levels per tissue are scatter plotted with each other. Correlations and statistical significance were analyzed using Spearman's rank test. P-values and R2 are shown.

