Figure 2.
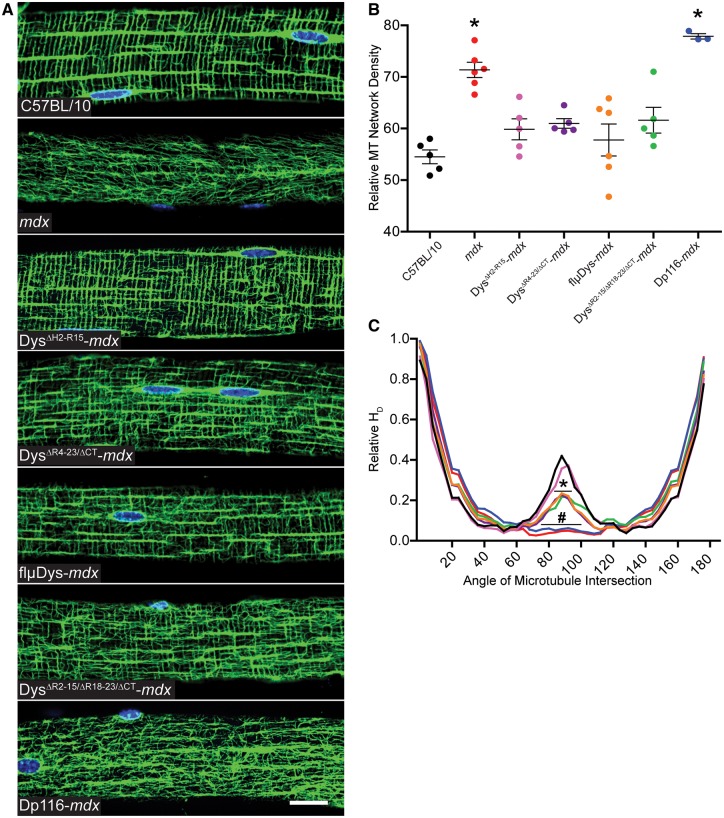
Effect of mini- and micro-dystrophin expression on microtubule lattice organization and densification. (A) Subsarcolemmal microtubules were organized into a precise perpendicular lattice in EDL fibers from C57BL/10 and DysΔH2-R15-mdx; an intermediate lattice in DysΔR4–23/ΔCT-mdx, flμDys-mdx and DysΔR2–15/ΔR18–23/ΔCT-mdx; and a disorganized lattice in mdx and Dp116-mdx. Images are representative of those obtained for n≥10 fibers from n≥5 mice for each genotype except Dp116-mdx where n=3. Scale bar is 20 μm. (B) Microtubule density significantly varied across genotypes by one-way ANOVA (P<0.001). Mdx and Dp116-mdx exhibited significantly more dense microtubule lattices compared to C57BL/10 by Dunnett’s post-test (*P<0.001). The four mini-/micro-Dys lines were all restored to densities not different from density in C57BL/10 mice. (C) Transverse microtubules (near 90°) were not significantly different between DysΔH2-R15-mdx and C57BL/10. DysΔR4–23/ΔCT-mdx, flμDys-mdx and DysΔR2–15/ΔR18–23/ΔCT-mdx all exhibited significantly less transverse microtubules than C57BL/10, but also significantly more than mdx. Dp116-mdx was not different from mdx, which had significantly less transverse microtubules than all other lines. Angle of microtubule intersection varied by genotype (interaction P<0.001) in a two-way ANOVA. Bonferroni post-hoc t-test analysis concluded that DysΔR4–23/ΔCT-mdx, flμDys-mdx and DysΔR2–15/ΔR18–23/ΔCT-mdx were significantly less than C57BL/10 at *P<0.001 from 84 to 92°. Dp116-mdx and mdx were significantly less than C57BL/10 at #P<0.001 from 76 to 100°. The colors of the microtubule directionality traces match the symbol color-to-genotype scheme used in Figure 2B. Error bars are mean±SEM.

