Figure 6.
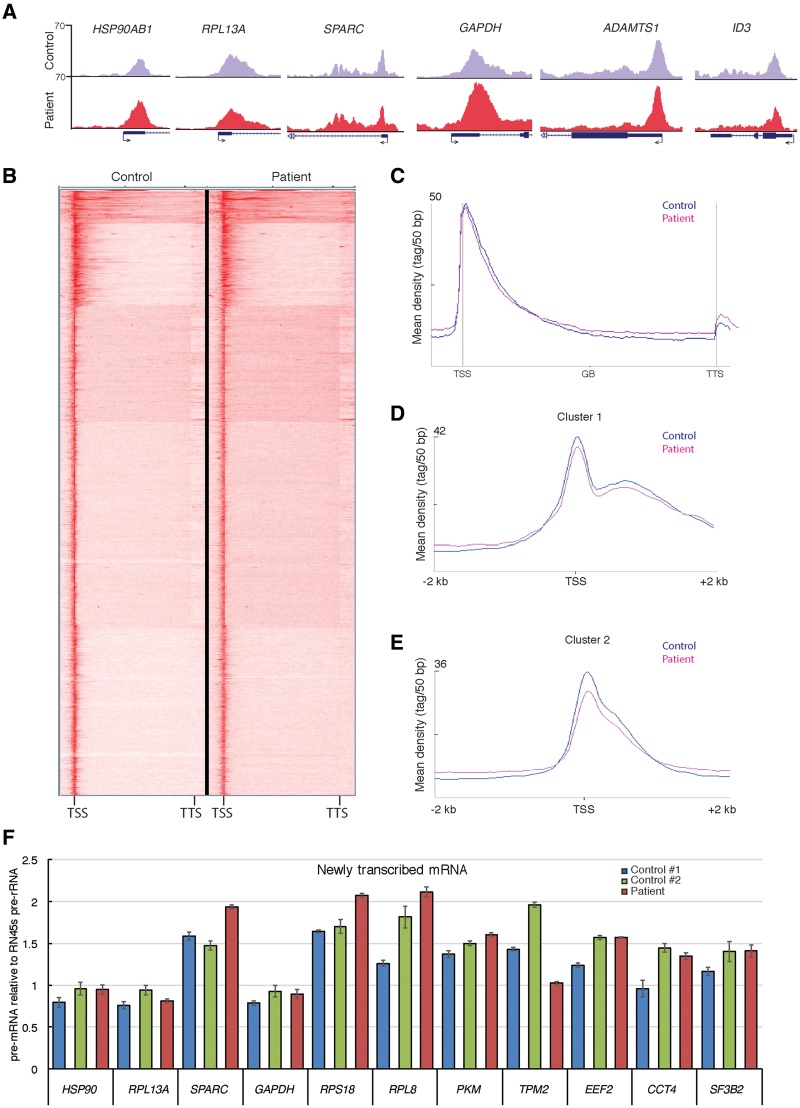
Genome wide RNA polymerase II occupancy and transcription is not significantly effected in fibroblasts harboring the TAF8: c.781–1G > A mutation. (A) UCSC genome browser snapshots of randomly selected representative genes showing Pol II occupancy in control fibroblasts (HFF-1, purple) and TAF8: c.781-1G > A patient fibroblasts (red). Arrows at TSSs show the direction of transcription. (B) Heatmap of anti-Pol II ChIP-seq generated by K-means clustering in a window showing TSS to transcription termination site (TTS) of all genes in control and patient fibroblasts. (C) Metagene plots of all expressed Pol II transcribed genes, generated from spike-in normalized anti-Pol II ChIP-seq, on control fibroblasts and TAF8 mutant fibroblasts. Average Pol II profiles were calculated for every expressed refseq gene from –5 kb region upstream of every TSS, including the gene bodies (GBs), until +5 kb downstream from the TTS. The Y-axis shows mean tag/50 bp densities. (D and E) On the basis of the clustering of Pol II occupancy in the gene bodies (Supplementary Material, Fig. S3B) Cluster 1 (D), containing 580 genes (Supplementary Material, Table S3), and Cluster 2 (E), containing 1102 genes (Supplementary Material, Table S4), profiles from –2 to +2 kb relative to TSS are shown. From these profiles, the corresponding Pol II traveling ratios were calculated and are depicted in the Supplementary Material, Figure S3C and D. In C–E, control graphs are in blue and patient graphs in pink. (F) RT-qPCR of newly transcribed mRNA in control fibroblasts and TAF8: c.781-1G > A patient fibroblasts of 11 representative genes normalized to the Pol I transcribed 45S pre-rRNA. Primers for each gene amplify fragments either only in introns or overlapping intron–exon boundaries from the indicated pre-mRNA. See Supplementary Material, Table S1 for primer sequences.

