Figure 4.
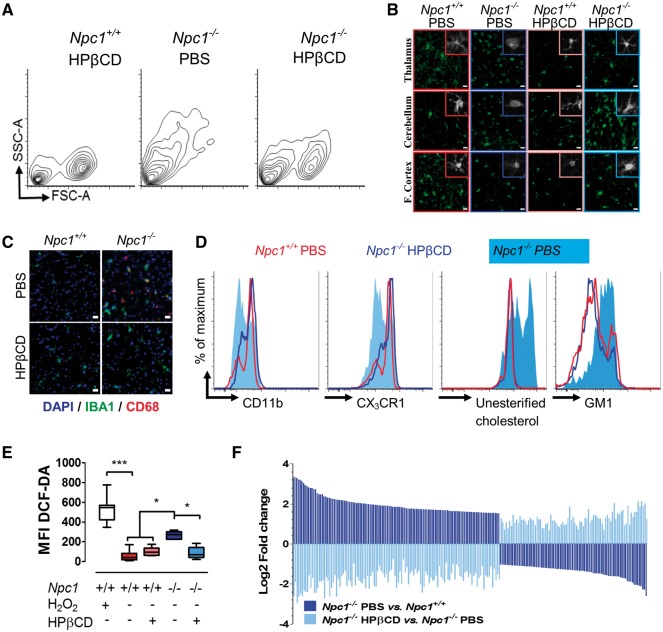
Effect of HPβCD treatment on Npc1−/− microglia. (A) Representative FACS analysis of 7-week-old Npc1+/+ and Npc1−/− mice injected twice a week with either phosphate buffered saline (PBS) or HPβCD starting at day of life 7. Cell size (FSC-A) and granularity (SSC-A) returned toward normal in the HPβCD compared to PBS treated mutant mice. (B) IBA1 staining (green) in the cerebellum, thalamus and frontal cortex of 7-week-old Npc1+/+ and Npc1−/− mice treated with either PBS or HPβCD is consistent with a less activated morphology in the HPβCD treated mice. Scale bar: 20 µm. (C) IBA1 (green), CD68 (red) double staining in the thalamus tissue from 7-week-old Npc1+/+ and Npc1−/− mice treated with either PBS or HPβCD demonstrates decreased microglial activation in HPβCD treated Npc1−/− mice. Scale bar: 20 µm. (D) FACS analysis of CD11b, CX3CR1, unesterified cholesterol and GM1 levels in microglia from Npc1+/+ treated with PBS (red line) and from Npc1−/− treated with either PBS (light blue shading) or HPβCD (dark blue line). (E) Total ROS production, ascertained by DCFDA staining of isolated microglia from 7-week old control and mutant mice, confirms decreased ROS in HPβCD treated mutant mice. Results are from three independent experiments with ≥3 samples per experiment. Each sample consisted of 10 000 microglial cells. (F) Microglial gene expression changes comparing Npc1−/− mice treated with PBS (dark blue) or HPβCD (light blue) versus Npc1+/+ injected with PBS and HPβCD. The 207 genes with padj<0.01 in both comparisons, are shown.

